Free Market Data Analytics Images Collection
Market Data Analytics delivers a dynamic photos collection that elevates visual storytelling with top-tier financial insights. Enjoy a transparent photos display showcasing innovative trends and high-quality digital data ideal for modern business strategies. Enhance your content with premium assets that capture the essence of financial analytics, trend analysis, and market performance.
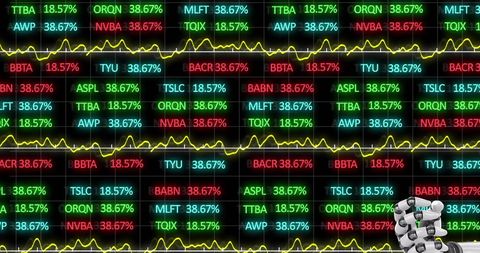
- market data grid
- city data analytics
- fruits market
- finance data team
- market data skyline
- digital data processing
- financial data alliance
- super market
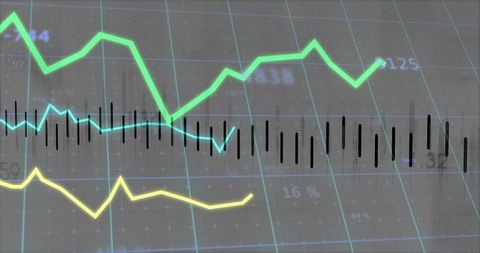
- diverse data analysis
- analytics
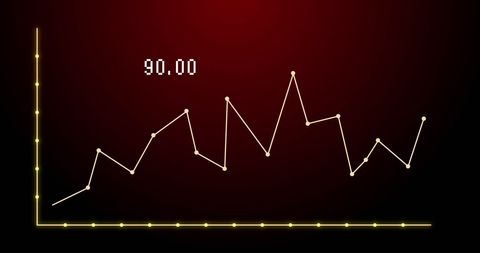
- market trends visuals
- business analytics fusion
- city economic data
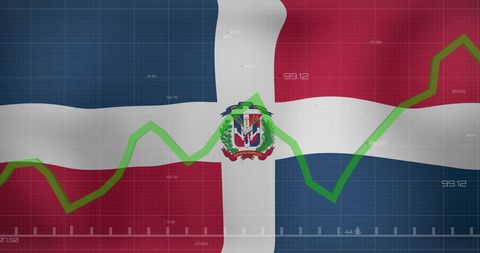
- global market charts
- market analysis team
- capital market trends
- digital data globe
- global financial analytics
- digital market vista