Free Market Metrics Images Collection
Experience the power of Market Metrics with our premium stock collection featuring a dynamic photos display that captures modern business excellence. Our curated assets offer transparent visual solutions designed to elevate financial analytics and creative storytelling. Enhance your projects with innovative digital imagery that delivers impactful market insights and vibrant content quality.
- market data skyline
- super market
- digital market network
- market analysis team
- capital market trends
- market trends visuals
- graph network metrics
- global market charts
- chart metrics
- city market trends
- fintech images
- business finance charts
- covid concepts
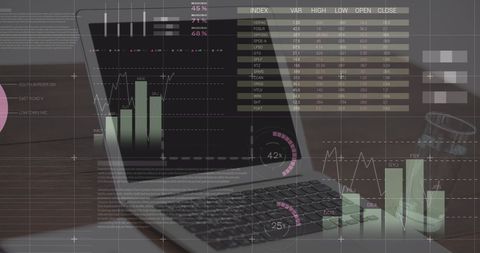
- digital data processing
- finance data team
- financial data alliance
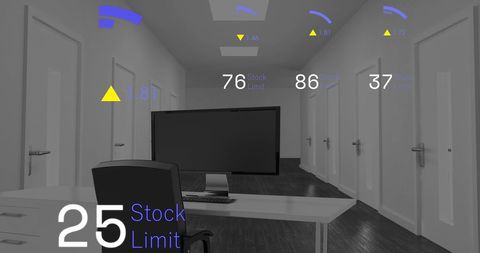
- modern office metrics
- global communication hub
- processing