Graph illustrating sharp decline in economic performance. Chain and dollar sign symbolize associated downturn, inflation and financial loss. Ideal content for discussions and publications regarding fiscal crises and economic instability.
  1. Home > 
  2. Most Popular Photos  >  
  3. Trading Chart

Free Trading Chart Pictures

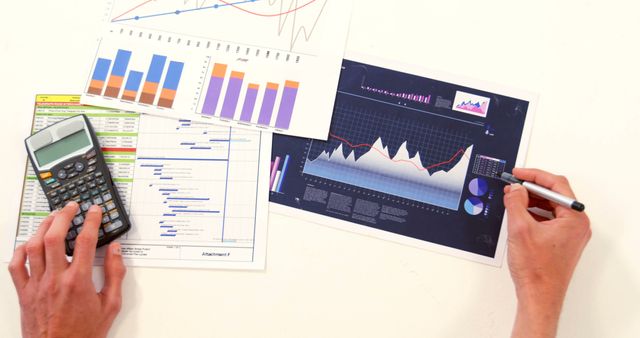
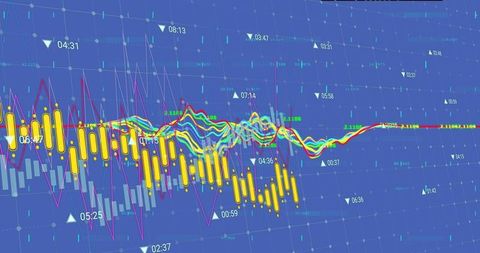
Explore a comprehensive collection of free trading chart images designed for blogs, websites, and presentations. These high-quality visuals showcase market trends, financial data, and trading graphs in a variety of styles. Whether you’re creating content about investments, stock markets, or financial insights, these images add clarity and professionalism to your projects. Download and use them freely to enhance your financial content with engaging and informative visuals.

Chained Dollar Sign on Downward Economic Graph
Dynamic Financial Data and Currency Charts for Investment Analysis
Futuristic Data Visualization with Trading Analytics and Cutting-Edge Interface
Futuristic Candlestick and Line Graph Trading Visualization
Premium
Animated Green Line Graph on Digital Grid Background
Global Tech Finance Interface with Globe and Graphs
Hand Pointing at Rising Bar Graph Projecting Growth
Digital Currency Exchange Rate Grid on Modern Trading Floor
Engineers Analyzing Data with Financial Graphs and Mathematics
Determined Analyst Examining Financial Data Late at Night
Abstract Data and Technology with Business Facilitator
3D Bar Graph with Upward Red Arrow on Concrete Background
Financial Data Technology Concept Over Urban Cityscape
Confident Businessman with Headset in Financial Setting Outline
Premium
Digital Line Graph with Data Points and Numeric Observations
Descending Stock Market Graph Illustrating Financial Decline
Digital Interface Over Financial Data Stock Market Analysis
Digital Financial Trading Chart with Candlestick Patterns
Dynamic Candlestick Chart with Code and Trendline Elements
Premium
Business Hand Drawing Upward Rising Graph Line Showing Growth
Abstract Financial Charts in Futuristic Design
Premium
Premium
Digital World Map and Graph Overlay with Business Professionals in Motion
Premium
Premium
Businesswoman Analyzing Stock Market Data with Technology
Digital Trading Dashboard with Line and Bar Charts
Dynamic Financial Graphs with Annotations on Black Background
Premium
Digital Financial Market Analytics Chart and Global Visualization
Business Analytics Concept with Laptop and Graphs on Desktop
Premium
Financial Charts Overlaying Modern Office Space
Financial Data Analytics Displayed Over Urban Cityscape
Premium
Digital Stock Market with Red Arrows and Analytics Icons
Visualizing Stock Market Trends with Floating Analytics Icons
Digital Helix Over Financial Trading Dashboard with Market Indicators
Futuristic Financial Data Visualization with Candlestick Charts
Dynamic Digital Trading Dashboard with Candlestick Charts
Digital Financial Chart with Mathematical Annotations
Business Growth Concept with Rising Graph Illustration
Dynamic Stock Market Trends on Dark Trading Screen
Complex Stock Market Graph with Overlaid HTML Code Representation
Abstract Financial Graph and Data Analysis Background
Premium
Fluctuating Line Chart Over Binary Digits in Digital Dashboard
Stock Market Data Display on Trading Desk
Premium
Businesswoman Analyzing Financial Statistics with Confidence
Premium
Rising Magenta Bar Chart on Digital Trading Interface
Abstract Financial Data on Digital Trading Screen with Red Line Overlay
3D Green Candlestick Chart Visual on Dark Digital Dashboard
Premium
Confident Businessman with Stock Market Graph Background
Time Management and Financial Growth Conceptual Illustration
Premium
Abstract Blue Finance Chart with Currency Exchange Data Display
Dynamic Financial Trading Candlestick Chart with Grid Analysis
Digital Financial Downtrend with Graphs and Charts on Grid Background
Rising Bar Chart Indicators in Financial Digital Interface
Analyzing Financial Graphs and Data at Office Desk
Rising Market Graph Overlaid on Sellers' Stands Highlights Economic Trends
High-tech Financial Trading Dashboard Display with Data Analysis
Digital Finance Chart with Candlesticks and Trendline Analytics
Green Arrow and Line Graph Symbolizing Stock Market Growth
Smartphone with Earth and Graphs for Business Analysis Concept
Premium
Economic Decline with Falling Red Graph Over US Currency
Dynamic Trading Screen with Candlestick Chart and Line Graphs
Dynamic Financial Dashboard with Candlestick and Line Charts Animation
Digital Financial Chart with Data Metrics and Analysis
Dynamic Financial Market Analysis with Modern Interface
Premium
Collaborative Team Analyzing Stock Market Trends
Logistics Team Working with Dynamic Data Metrics Visualizing Efficiency
Hourglass of Bills with Bar Graph and Rising Arrow Depicting Economic Growth
Dynamic Financial Data Visualization with Candlestick Charts
Premium
Financial Planner's Workspace with Document and Graphs
Businessman Analyzing Graph Data on Office Computer
Premium
Businessman Highlighting Increasing Bar Graph Data
Premium
Premium
Financial Chart with Yellow Candlesticks and Trend Lines
Premium
Financial Data Visualization with Gold Bullion Background
Digital Data Graph with Green Line Over Blue Grid Background
Colorful Candlestick and Line Chart with Data Dashboard Elements
Futuristic Financial Data Analytics with Candlestick Charts
Tablet with Financial Graph on Wooden Desk
Business Growth Concept with Eco-Friendly Rising Graph in Cityscape
Digital Graphs and Data Analysis Hologram
Premium
Time is Money Concept with Hourglass and Dollar Bills
Energy Efficiency Chart and Coins on Wooden Table
Hourglass with Coins and Cash, Symbolizing Financial Growth Trends
Futuristic Financial Chart with Vector Display on Digital Grid
Professional Analyzing Stock Market Data on Laptop Desk Setup
Digital Trading Dashboard with Candlestick Chart and Data Insights
Premium
Dynamic Digital Currency Exchange Trends with Analytics Graphs
Dynamic Financial Chart Over Urban Night Skyline Reflecting Market Trends
Premium
Logistics Workers Loading Boxes with Data Overlays
Green Bar and Line Chart on Digital Grid Background
Dynamic Graph Display for Real-Time Data Analysis
Financial Analytics Screen with Candlestick Charts and Data Visualization
Premium
Business Analytics with Graphs and Calculator on Desk
Close-Up of Laptop Showing Financial and Business Analytics Data
Colorful Line Graph on Dark Analytical Dashboard Background
Digital Trading Interface Displaying Market Movements
Dynamic Candlestick Chart on Grid with Light Waves Visualization
Tired Man Analyzing Financial Graphs at Night
Coworkers Analyzing Data with Stock Market and Code Overlay
Abstract Financial Data with Green Arrows and Graphs
Dynamic Financial Chart Display with Candlestick Patterns and Trend Lines
Dynamic Financial Data and Progress Chart Display
Analytical Trader Studying Stock Trends in Modern Workspace
Stock Market Analytics with Envelope Icon and Data Indicators
Hand Interacting with Virtual Digital Graph Interface
Red Graph Over U.S. Dollar Background Signifying Economic Crisis
Dynamic Trading Chart with Candlesticks and Trend Analysis
Financial Market Data Display with Stock Tickers and Analytics Overlay
Dynamic Candlestick Chart with Circuit Overlays
Premium
Premium
Confident Businesswoman with Graph in Urban Setting
Hands Analyzing Financial Graphs with Calculator on Desk
Dynamic Financial Data Visualization with Stock Market Graphs
Explore More Free Stock Images