
Free Global Financial Interface Videos Collection
Experience the excellence of our premium stock assets within the Global Financial Interface, showcasing a dynamic videos collection and innovative digital data visualization. Elevate your creative projects with expertly curated assets that integrate cutting-edge financial analytics and global business trends. Trust the Global Financial Interface to deliver superior, transparent asset displays that enhance every digital performance with unmatched quality.
- digital global map
- data interface
- financial cityscapes
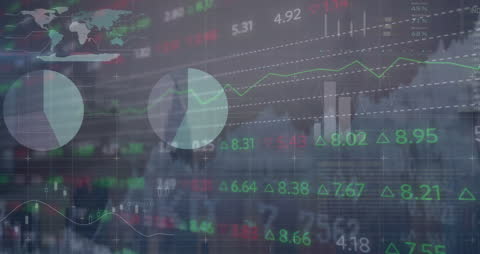
- financial data
- global network encryption
- global business network
- digital interface
- global finance grid
- digital financial analysis
- financial market trends
- global economy
- financial analytics
- financial fusion
- corporate growth trends
- financial technology
- environment
- global pandemic analytics
- global data technology