Free Visual Metrics Images Collection
Visual Metrics delivers a premium stock collection that enhances your digital projects with dynamic photos and creative visuals. Our platform integrates innovative and transparent asset displays to empower tech-driven campaigns and modern business presentations. Experience superior quality and versatile imagery that blend cutting-edge technology with artistic vision for impactful results.
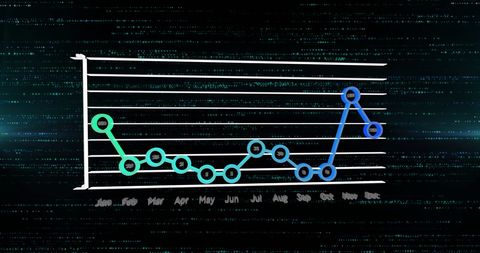
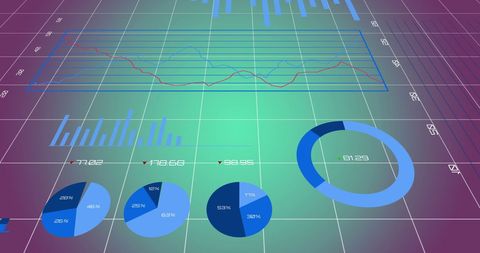
- graph network metrics
- abstract visual
- visual archive
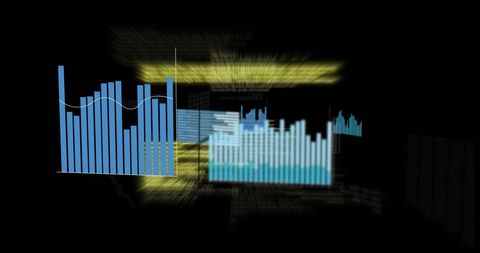
- analysis stick diagram
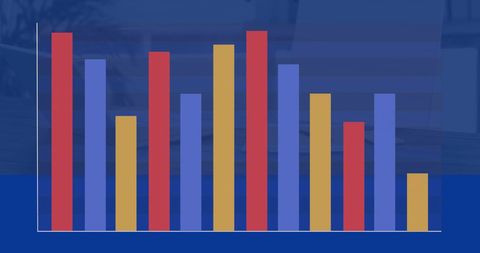
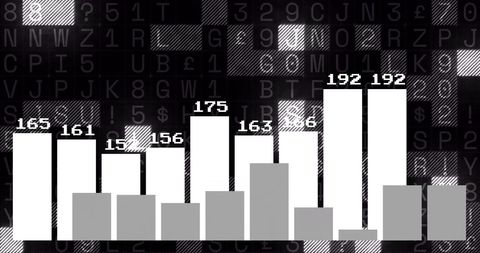
- chart metrics
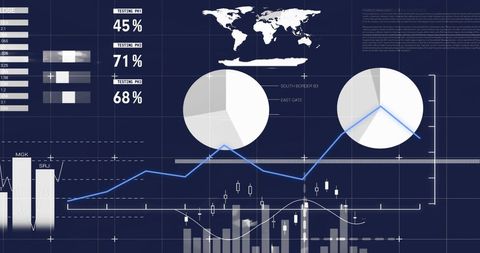
- visual data
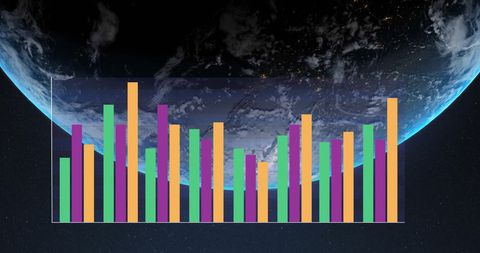
- city data analytics
- finance data team
- digital globe matrix
- office strategy
- fintech images
- market growth trends
- medical visualization
- business finance charts
- information technology
- data innovation
- performance data
- molecular research