- Home >
- Stock Photos >
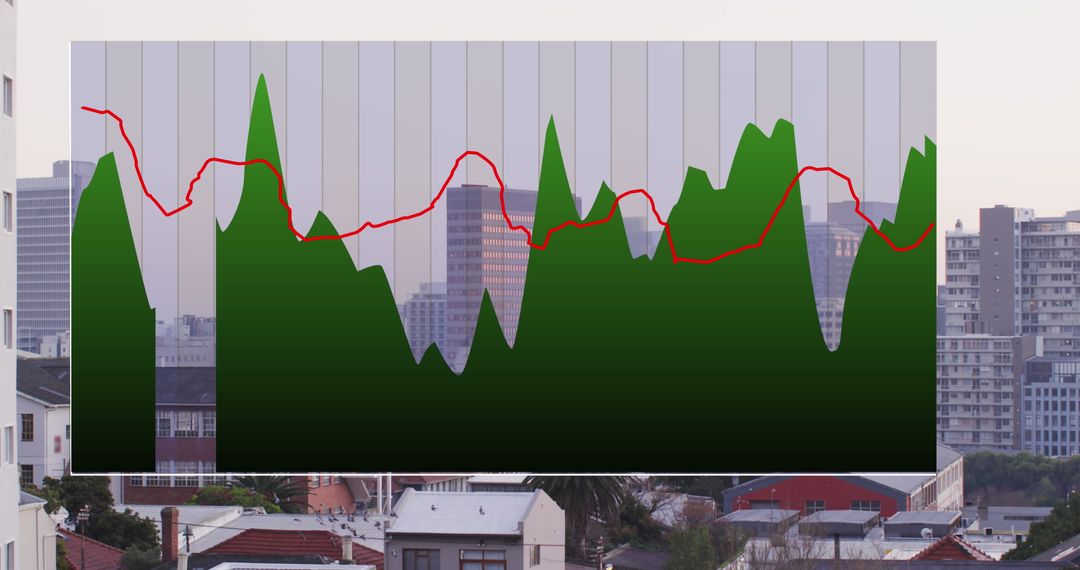
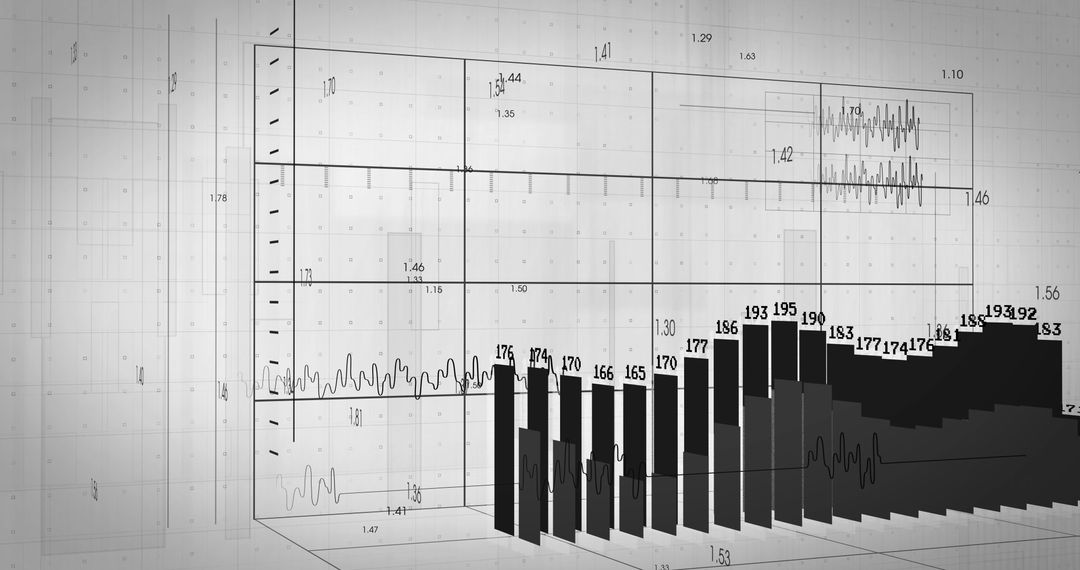
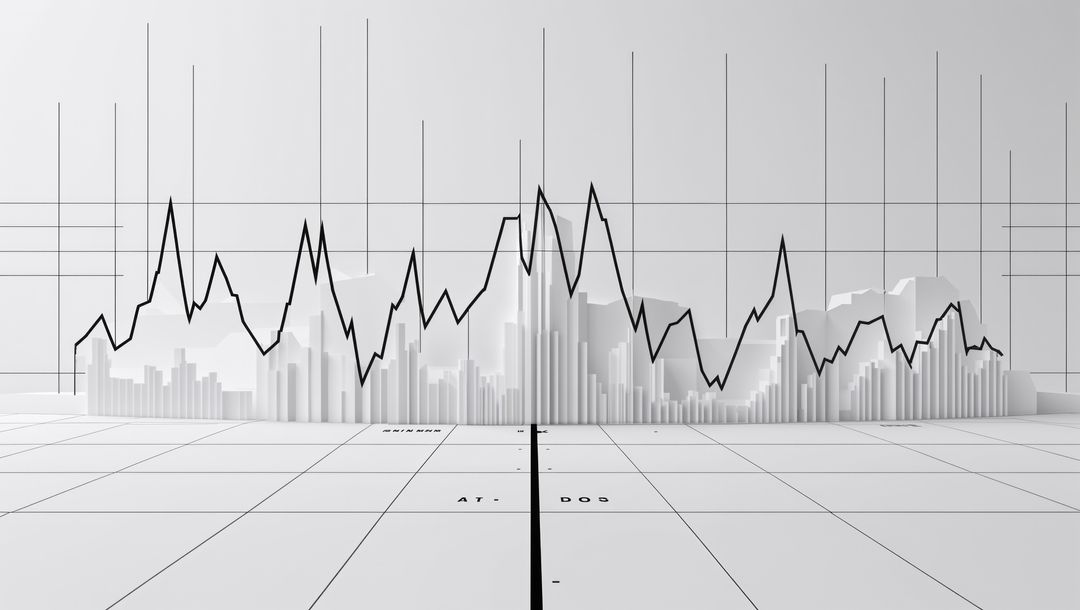
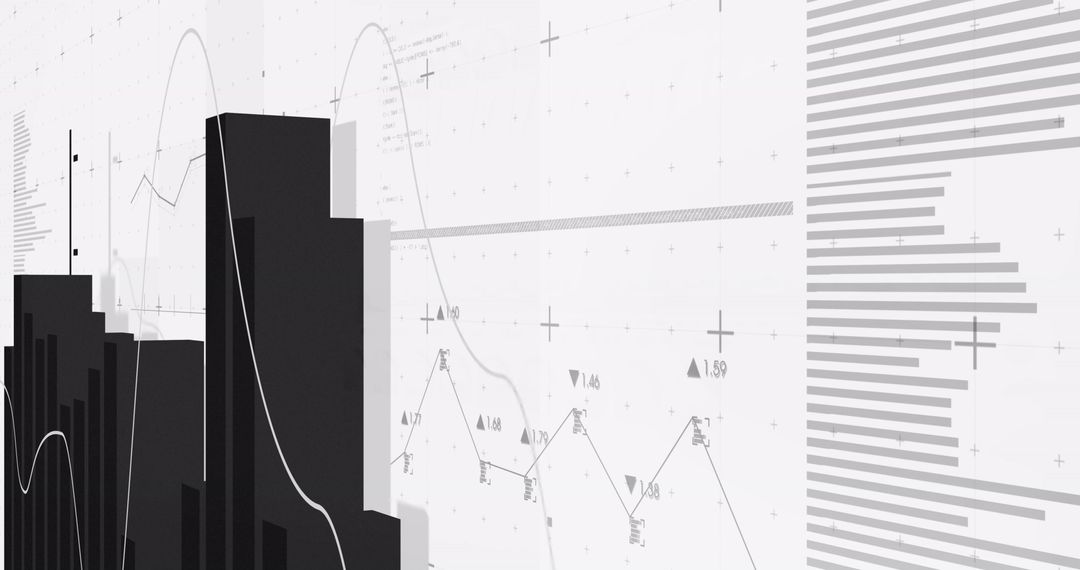
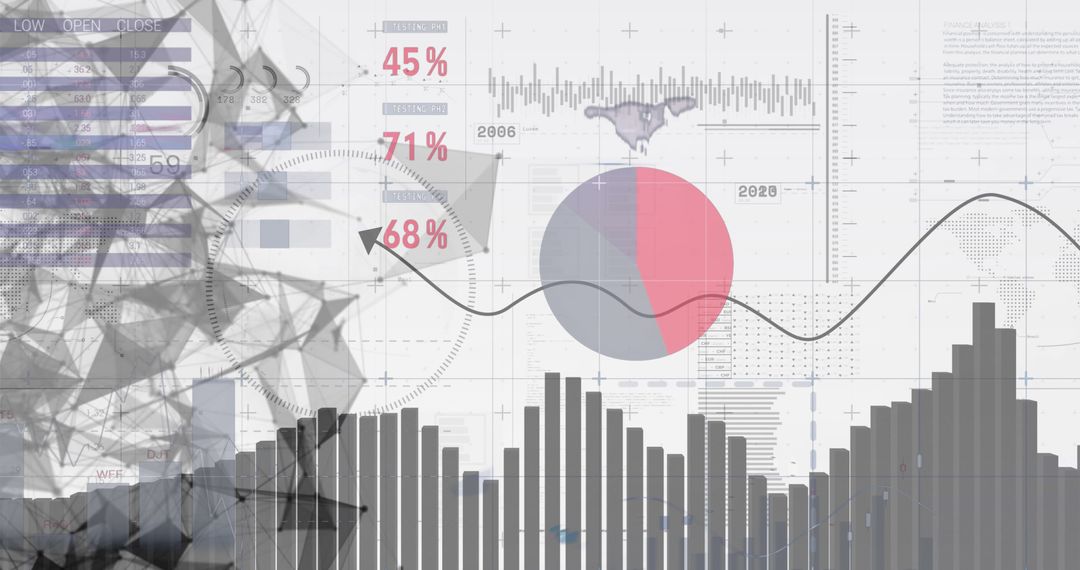
- 3d area chart with black trend line on white surface, seismograph concept
3d area chart with black trend line on white surface, seismograph concept Image
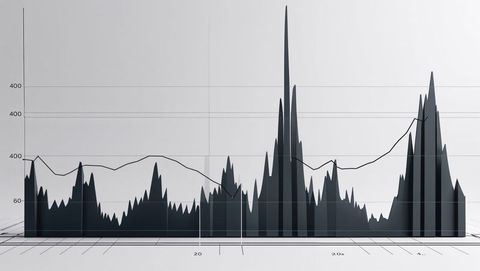
AI Generated Image. Three-dimensional area chart displaying fluctuating data, with a bold black trend line resembling seismograph waveforms highlighted on a sleek white background. Useful for presentations on business analytics, financial reports, technology solutions, and data science. Minimalist and modern look enhances engagement, offering visual representation of complex metrics in digital frameworks.
Powered by  - Get 15% off with code: PIKWIZARD15


4
downloads
downloads
Tags:
More
Credit Photo
If you would like to credit the Photo, here are some ways you can do so
Text Link
photo Link
<span class="text-link">
<span>
<a target="_blank" href=https://pikwizard.com/photo/3d-area-chart-with-black-trend-line-on-white-surface-seismograph-concept/bb96d26bee838fdc18d8f422f5a508e3/>PikWizard</a>
</span>
</span>
<span class="image-link">
<span
style="margin: 0 0 20px 0; display: inline-block; vertical-align: middle; width: 100%;"
>
<a
target="_blank"
href="https://pikwizard.com/photo/3d-area-chart-with-black-trend-line-on-white-surface-seismograph-concept/bb96d26bee838fdc18d8f422f5a508e3/"
style="text-decoration: none; font-size: 10px; margin: 0;"
>
<img src="https://pikwizard.com/pw/medium/bb96d26bee838fdc18d8f422f5a508e3.jpg" style="margin: 0; width: 100%;" alt="" />
<p style="font-size: 12px; margin: 0;">PikWizard</p>
</a>
</span>
</span>
Free (free of charge)
Free for personal and commercial use.
Author: AI Creator
Similar Free Stock Images

Premium


Premium


Premium


Premium


Premium


Premium


Premium


Premium


Premium


Premium


Premium


Premium


Premium


Premium


Premium


Premium


Premium


Premium


Premium


Premium


Premium


Premium


Premium


Premium