
- Home >
- Stock Photos >
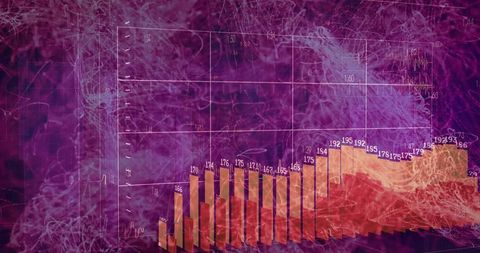
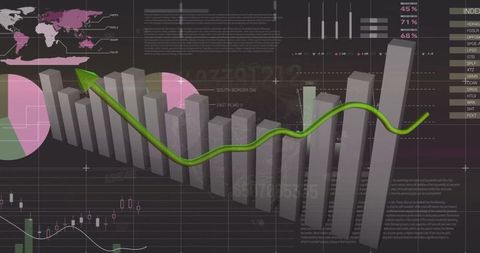
- 3D Bar and Line Graph with Digital Interface Elements
3D Bar and Line Graph with Digital Interface Elements Image

Modern depiction of data analytics with a combination of three-dimensional bar graphs and line charts. Background filled with numerical data provides context of technical analysis or statistics. Incorporating digital interface elements suggests the usage in presentations related to data insights, technology developments, and business strategies. Ideal for illustrating concepts in reports, tutorials, and data-driven projects aiming for clarity and modernity.
Powered by 


downloads
Tags:
More
Credit Photo
If you would like to credit the Photo, here are some ways you can do so
Text Link
photo Link
<span class="text-link">
<span>
<a target="_blank" href=https://pikwizard.com/photo/3d-bar-and-line-graph-with-digital-interface-elements/039ced71accfb7565d488763a4266776/>PikWizard</a>
</span>
</span>
<span class="image-link">
<span
style="margin: 0 0 20px 0; display: inline-block; vertical-align: middle; width: 100%;"
>
<a
target="_blank"
href="https://pikwizard.com/photo/3d-bar-and-line-graph-with-digital-interface-elements/039ced71accfb7565d488763a4266776/"
style="text-decoration: none; font-size: 10px; margin: 0;"
>
<img src="https://pikwizard.com/pw/medium/039ced71accfb7565d488763a4266776.jpg" style="margin: 0; width: 100%;" alt="" />
<p style="font-size: 12px; margin: 0;">PikWizard</p>
</a>
</span>
</span>
Free (free of charge)
Free for personal and commercial use.
Author: Creative Art
Similar Free Stock Images

Premium


Premium

Premium


Premium


Premium


Premium

Premium

Premium


Premium


Premium


Premium

Premium

Premium


Premium


Premium


Premium


Premium


Premium


Premium


Premium


Premium


Premium


Premium


Premium


Premium


Explore More Free Stock Images