- Home >
- Stock Photos >
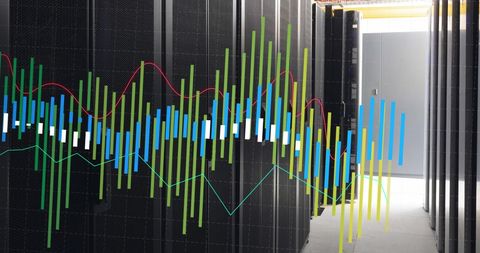
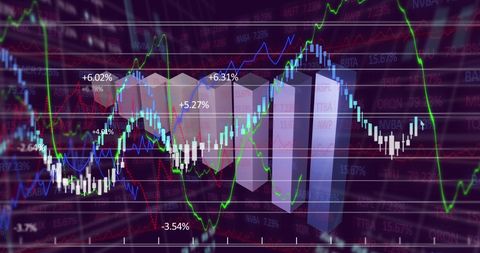
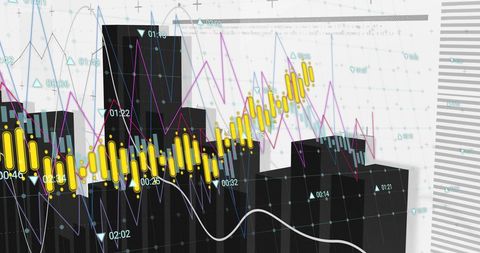
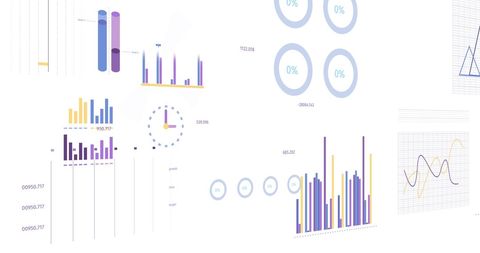
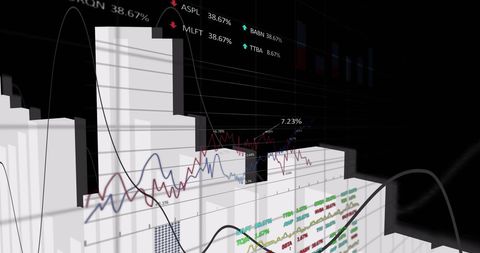
- 3D Bar and Line Graphs Showing Financial Data Analytics
3D Bar and Line Graphs Showing Financial Data Analytics Image

Dynamic representation of financial data using 3D bar and line graphs ideal for illustrating business analytics. Useful in business presentations, data analysis tutorials, and market trend illustrations. Suitable for infographics focusing on finance, technology, and digital globalization.

downloads
Tags:
More
Credit Photo
If you would like to credit the Photo, here are some ways you can do so
Text Link
photo Link
<span class="text-link">
<span>
<a target="_blank" href=https://pikwizard.com/photo/3d-bar-and-line-graphs-showing-financial-data-analytics/fbe51ab422a4ecc83a929028b2cf724f/>PikWizard</a>
</span>
</span>
<span class="image-link">
<span
style="margin: 0 0 20px 0; display: inline-block; vertical-align: middle; width: 100%;"
>
<a
target="_blank"
href="https://pikwizard.com/photo/3d-bar-and-line-graphs-showing-financial-data-analytics/fbe51ab422a4ecc83a929028b2cf724f/"
style="text-decoration: none; font-size: 10px; margin: 0;"
>
<img src="https://pikwizard.com/pw/medium/fbe51ab422a4ecc83a929028b2cf724f.jpg" style="margin: 0; width: 100%;" alt="" />
<p style="font-size: 12px; margin: 0;">PikWizard</p>
</a>
</span>
</span>
Free (free of charge)
Free for personal and commercial use.
Author: Creative Art