- Home >
- Stock Photos >
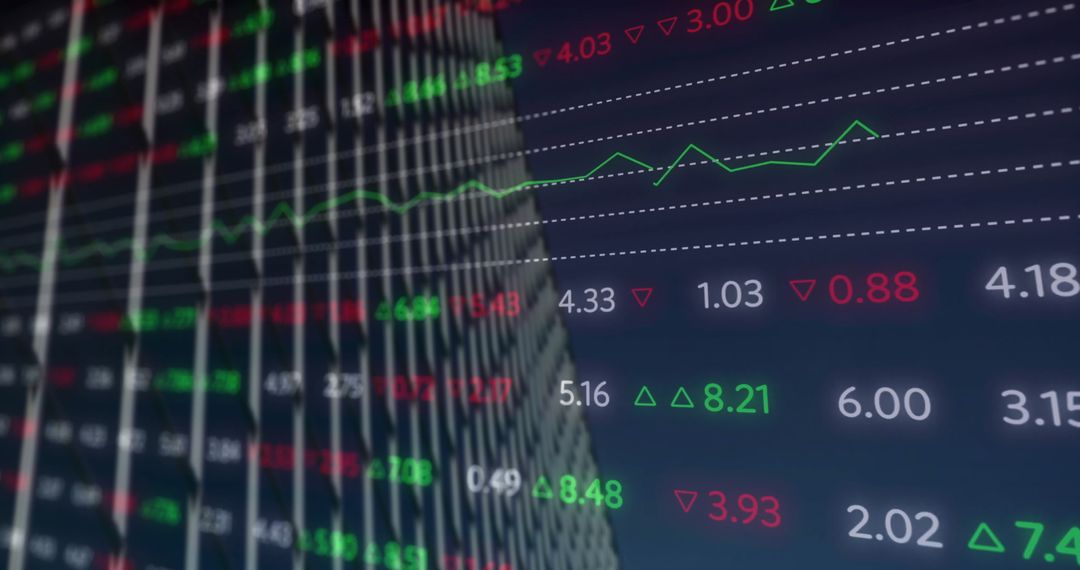
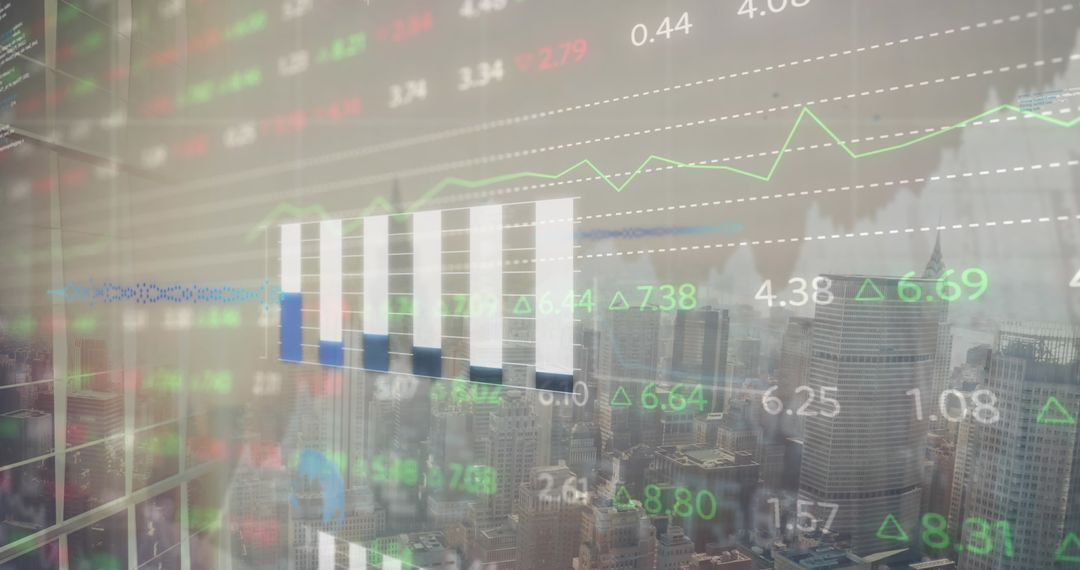
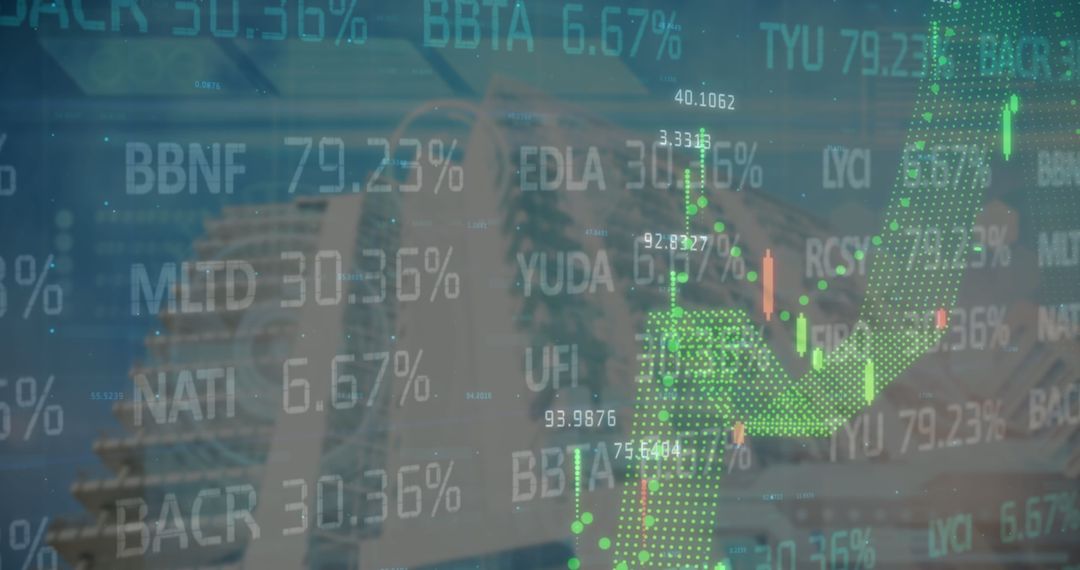
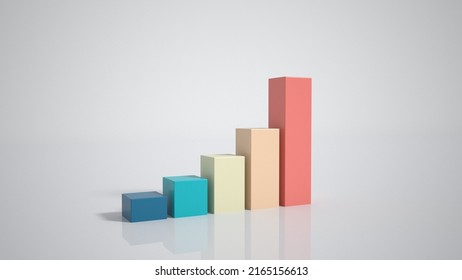
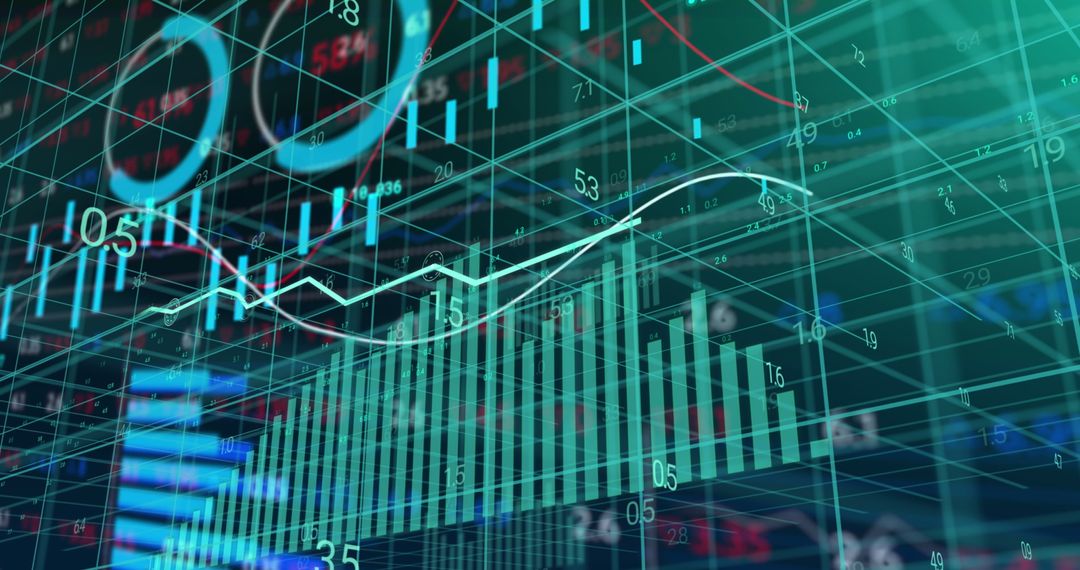
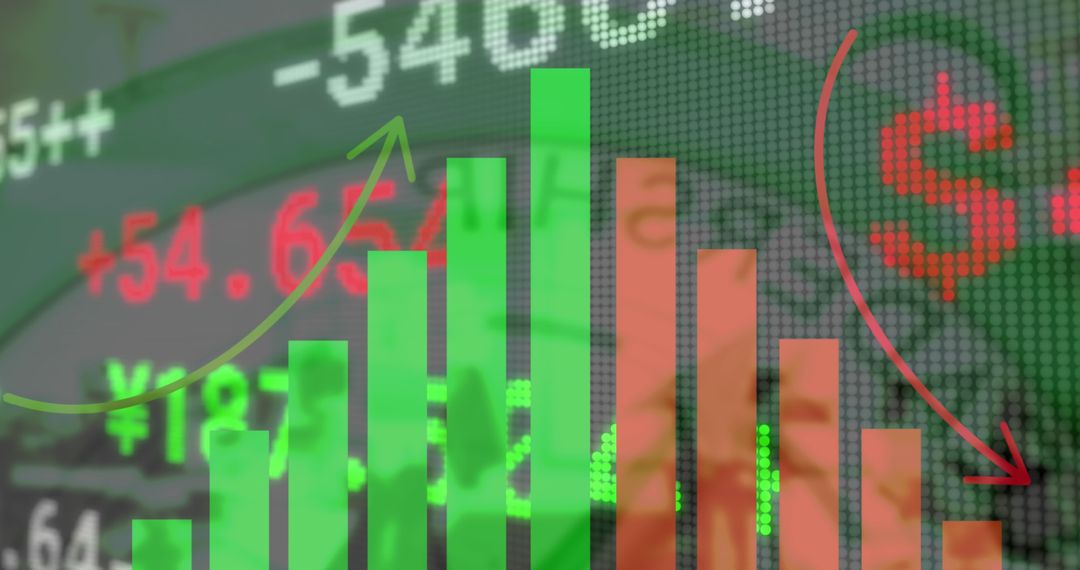
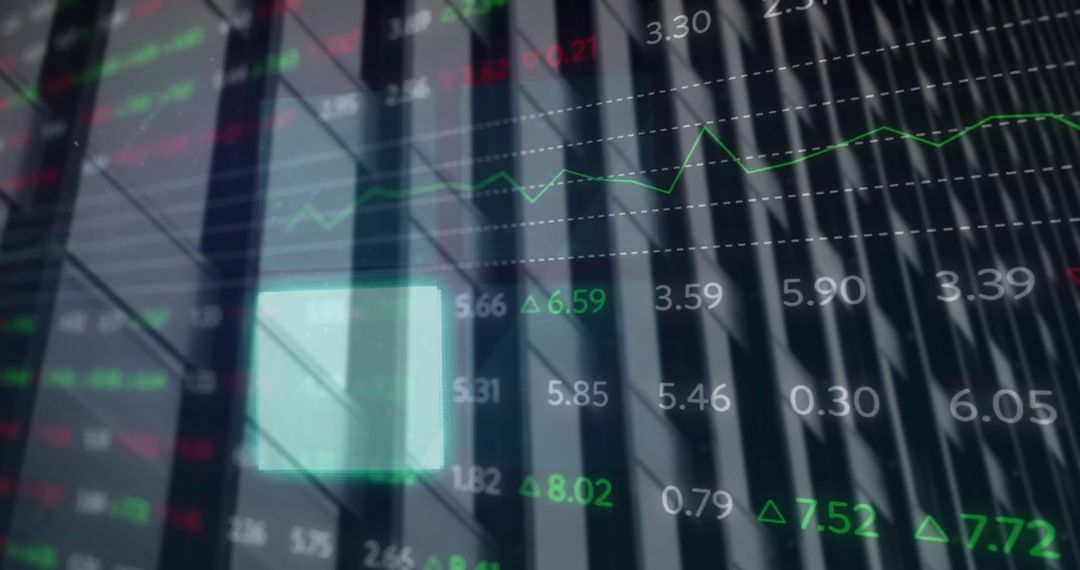
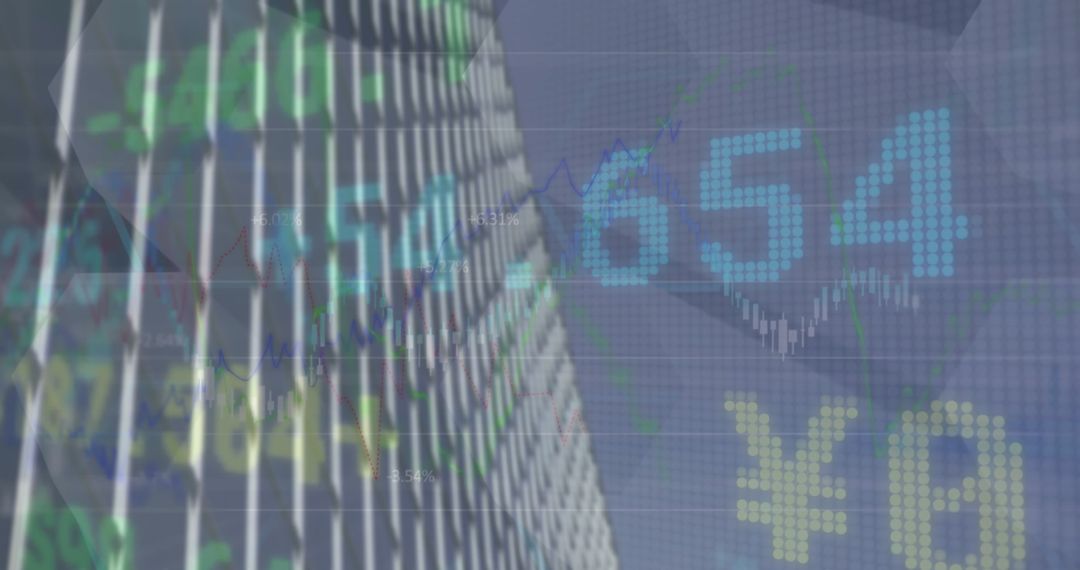
- 3D Bar Chart Analyzing Stock Trends in Digital Matrix
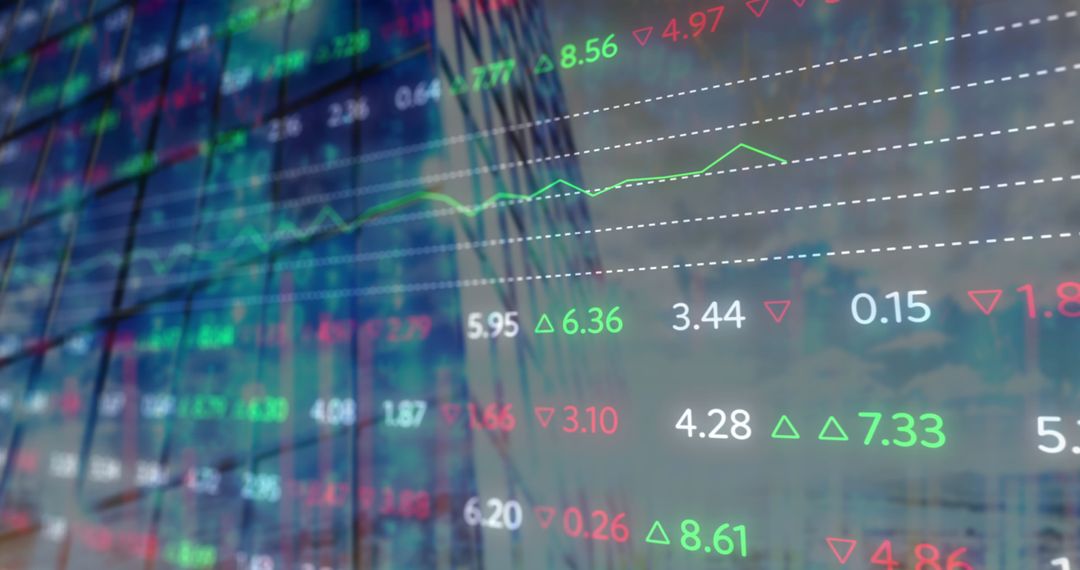
3D Bar Chart Analyzing Stock Trends in Digital Matrix Image

Dynamic representation of stock trends featuring a 3D bar chart alternating between green and red to indicate market fluctuations. Perfect for illustrating concepts related to stock market analysis, financial predictions, and the digital economy. This image can be used for financial news presentations, banking fintech applications, investment strategy seminars, or educational materials discussing the role of technology in modern data visualization.
Powered by  - Get 15% off with code: PIKWIZARD15


2
downloads
downloads
Tags:
More
Credit Photo
If you would like to credit the Photo, here are some ways you can do so
Text Link
photo Link
<span class="text-link">
<span>
<a target="_blank" href=https://pikwizard.com/photo/3d-bar-chart-analyzing-stock-trends-in-digital-matrix/6c49d24beb36f79fddf0c7a8dfa4a0fd/>PikWizard</a>
</span>
</span>
<span class="image-link">
<span
style="margin: 0 0 20px 0; display: inline-block; vertical-align: middle; width: 100%;"
>
<a
target="_blank"
href="https://pikwizard.com/photo/3d-bar-chart-analyzing-stock-trends-in-digital-matrix/6c49d24beb36f79fddf0c7a8dfa4a0fd/"
style="text-decoration: none; font-size: 10px; margin: 0;"
>
<img src="https://pikwizard.com/pw/medium/6c49d24beb36f79fddf0c7a8dfa4a0fd.jpg" style="margin: 0; width: 100%;" alt="" />
<p style="font-size: 12px; margin: 0;">PikWizard</p>
</a>
</span>
</span>
Free (free of charge)
Free for personal and commercial use.
Author: Creative Art
Similar Free Stock Images

Premium


Premium


Premium


Premium


Premium


Premium


Premium


Premium


Premium


Premium


Premium


Premium


Premium


Premium


Premium


Premium


Premium

Premium


Premium


Premium


Premium


Premium


Premium


Premium