- Home >
- Stock Photos >
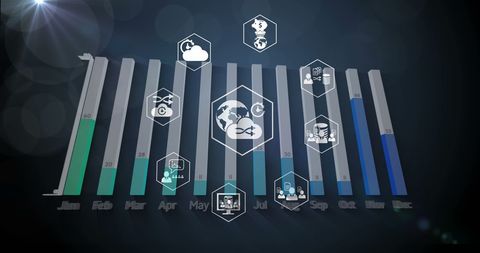
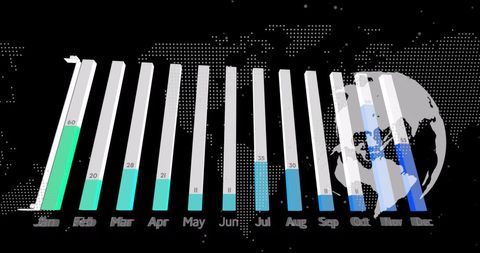
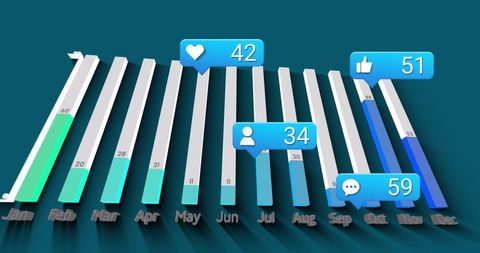
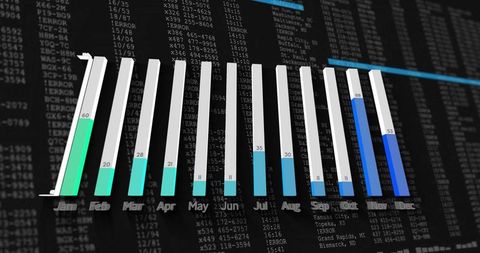
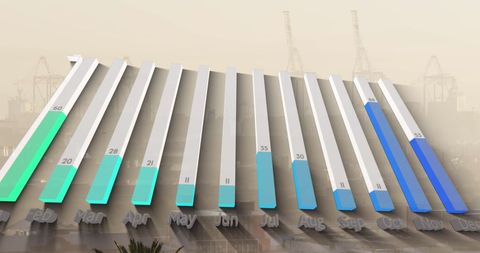
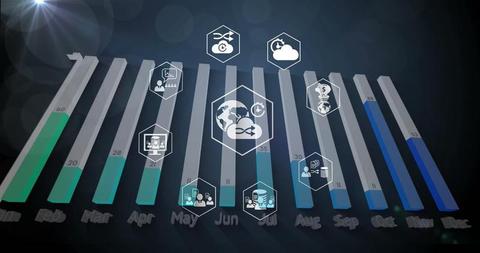
- 3D Bar Chart Displaying Monthly Data with Digital Interface Icons
3D Bar Chart Displaying Monthly Data with Digital Interface Icons Image

This dynamic 3D bar chart illustrates monthly statistics against a stylish dark background complemented by digital interface elements like chat bubbles and profile icons. Perfect for presentations or designs related to data analysis, business reporting, software dashboards, or infographics where audience engagement through visually striking digital elements is desired.
Powered by 


downloads
Tags:
More
Credit Photo
If you would like to credit the Photo, here are some ways you can do so
Text Link
photo Link
<span class="text-link">
<span>
<a target="_blank" href=https://pikwizard.com/photo/3d-bar-chart-displaying-monthly-data-with-digital-interface-icons/c0062862bdbb4f8f1d6f4e3f224d2bc8/>PikWizard</a>
</span>
</span>
<span class="image-link">
<span
style="margin: 0 0 20px 0; display: inline-block; vertical-align: middle; width: 100%;"
>
<a
target="_blank"
href="https://pikwizard.com/photo/3d-bar-chart-displaying-monthly-data-with-digital-interface-icons/c0062862bdbb4f8f1d6f4e3f224d2bc8/"
style="text-decoration: none; font-size: 10px; margin: 0;"
>
<img src="https://pikwizard.com/pw/medium/c0062862bdbb4f8f1d6f4e3f224d2bc8.jpg" style="margin: 0; width: 100%;" alt="" />
<p style="font-size: 12px; margin: 0;">PikWizard</p>
</a>
</span>
</span>
Free (free of charge)
Free for personal and commercial use.
Author: Creative Art