
- Home >
- Stock Photos >
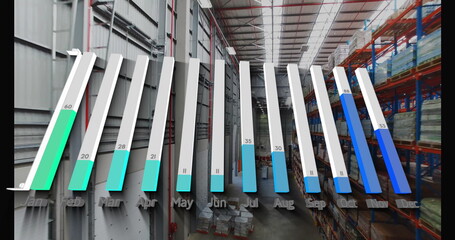
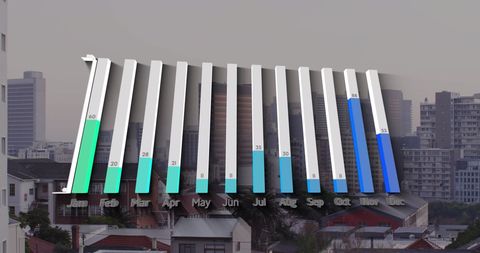
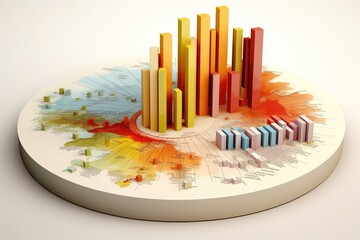
- 3D Bar Chart Displaying Monthly Warehouse Data
3D Bar Chart Displaying Monthly Warehouse Data Image

Digital chart showing monthly inventory levels in a modern warehouse environment. Useful for presentations on supply chain management, inventory analysis, and logistics optimization. Ideal for illustrating business data insights and trends in ebooks, reports, and educational materials.
Powered by 


downloads
Tags:
More
Credit Photo
If you would like to credit the Photo, here are some ways you can do so
Text Link
photo Link
<span class="text-link">
<span>
<a target="_blank" href=https://pikwizard.com/photo/3d-bar-chart-displaying-monthly-warehouse-data/e99be274a3924da95a958e4618ef1e2a/>PikWizard</a>
</span>
</span>
<span class="image-link">
<span
style="margin: 0 0 20px 0; display: inline-block; vertical-align: middle; width: 100%;"
>
<a
target="_blank"
href="https://pikwizard.com/photo/3d-bar-chart-displaying-monthly-warehouse-data/e99be274a3924da95a958e4618ef1e2a/"
style="text-decoration: none; font-size: 10px; margin: 0;"
>
<img src="https://pikwizard.com/pw/medium/e99be274a3924da95a958e4618ef1e2a.jpg" style="margin: 0; width: 100%;" alt="" />
<p style="font-size: 12px; margin: 0;">PikWizard</p>
</a>
</span>
</span>
Free (free of charge)
Free for personal and commercial use.
Author: People Creations
Similar Free Stock Images

Premium


Premium


Premium


Premium

Premium

Premium


Premium

Premium


Premium


Premium
Premium


Premium


Premium


Premium


Explore More Free Stock Images