
- Home >
- Stock Photos >
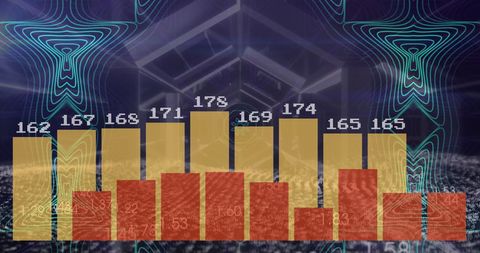
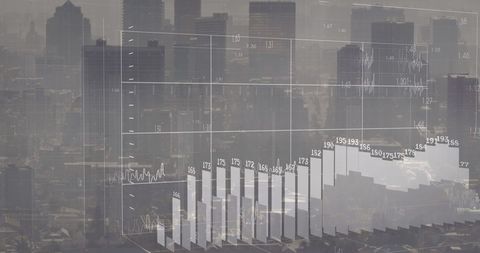
- 3D Bar Chart Illustrating Financial Data Analysis Process
3D Bar Chart Illustrating Financial Data Analysis Process Image
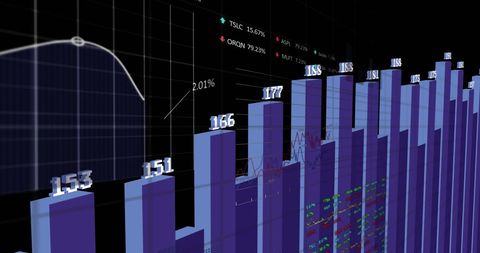
Representation of financial data analysis using a 3D bar chart design against a dark backdrop, showcasing statistical information and global business dynamics visually. Perfect for illustrating concepts like financial planning, business analysis, market trends in presentations, reports, webinars, and educational materials.
Powered by 


downloads
Tags:
More
Credit Photo
If you would like to credit the Photo, here are some ways you can do so
Text Link
photo Link
<span class="text-link">
<span>
<a target="_blank" href=https://pikwizard.com/photo/3d-bar-chart-illustrating-financial-data-analysis-process/f99863277c463f1fe4cf665f2e0a8717/>PikWizard</a>
</span>
</span>
<span class="image-link">
<span
style="margin: 0 0 20px 0; display: inline-block; vertical-align: middle; width: 100%;"
>
<a
target="_blank"
href="https://pikwizard.com/photo/3d-bar-chart-illustrating-financial-data-analysis-process/f99863277c463f1fe4cf665f2e0a8717/"
style="text-decoration: none; font-size: 10px; margin: 0;"
>
<img src="https://pikwizard.com/pw/medium/f99863277c463f1fe4cf665f2e0a8717.jpg" style="margin: 0; width: 100%;" alt="" />
<p style="font-size: 12px; margin: 0;">PikWizard</p>
</a>
</span>
</span>
Free (free of charge)
Free for personal and commercial use.
Author: Authentic Images
Similar Free Stock Images

Premium

Premium

Premium


Premium

Premium


Premium


Premium


Premium


Premium


Premium


Premium


Premium


Premium


Premium

Premium

Premium


Premium


Premium


Premium


Premium

Premium


Premium

Premium

Premium


Premium


Explore More Free Stock Images