- Home >
- Stock Photos >
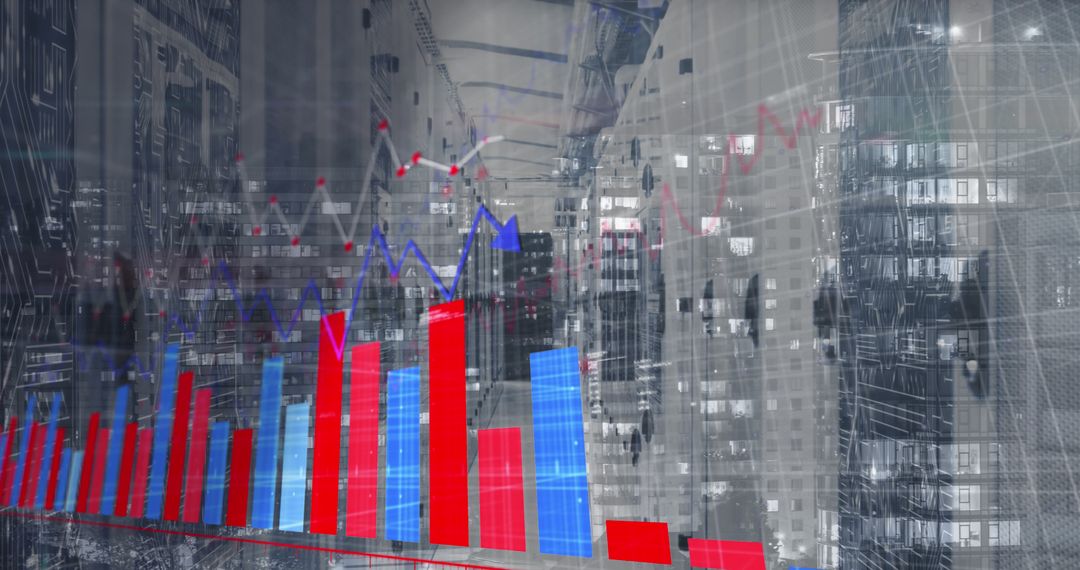
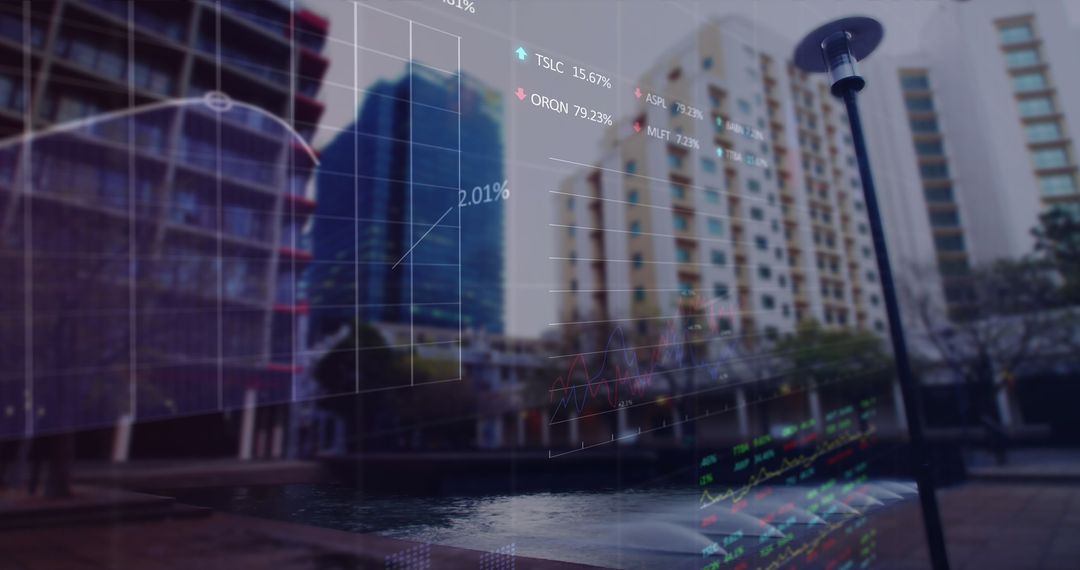
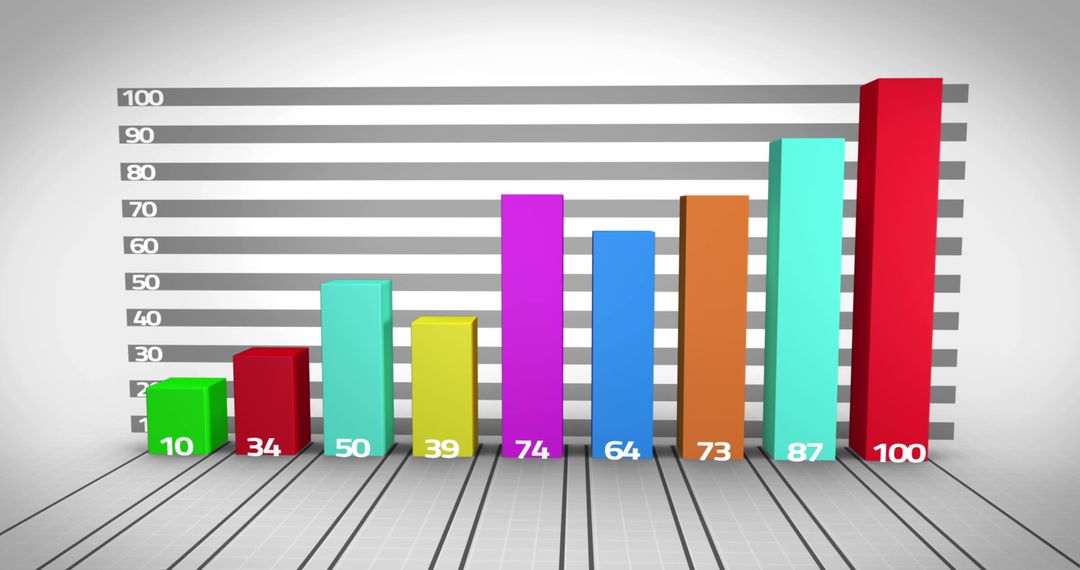
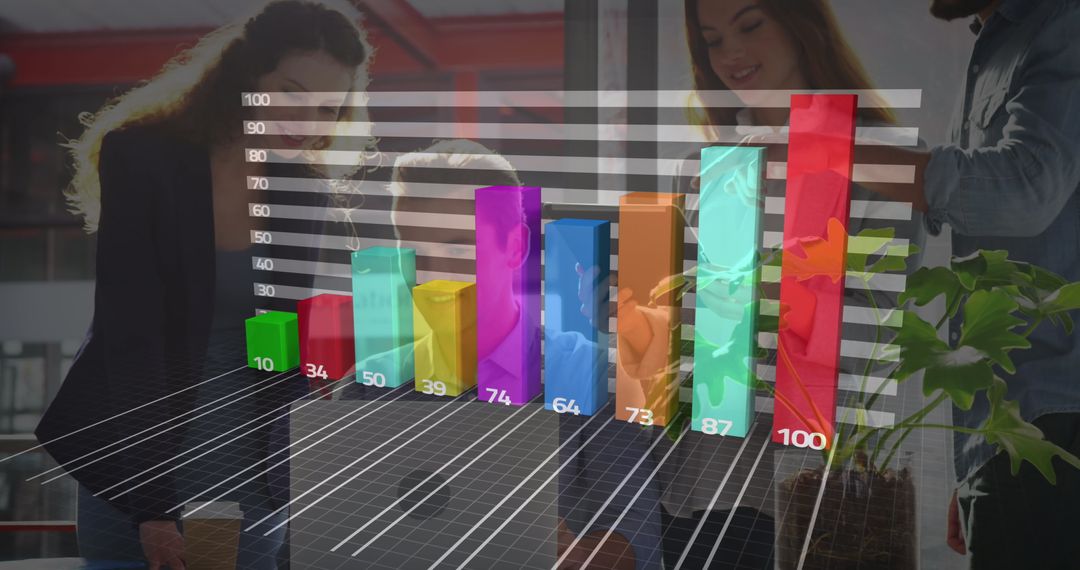
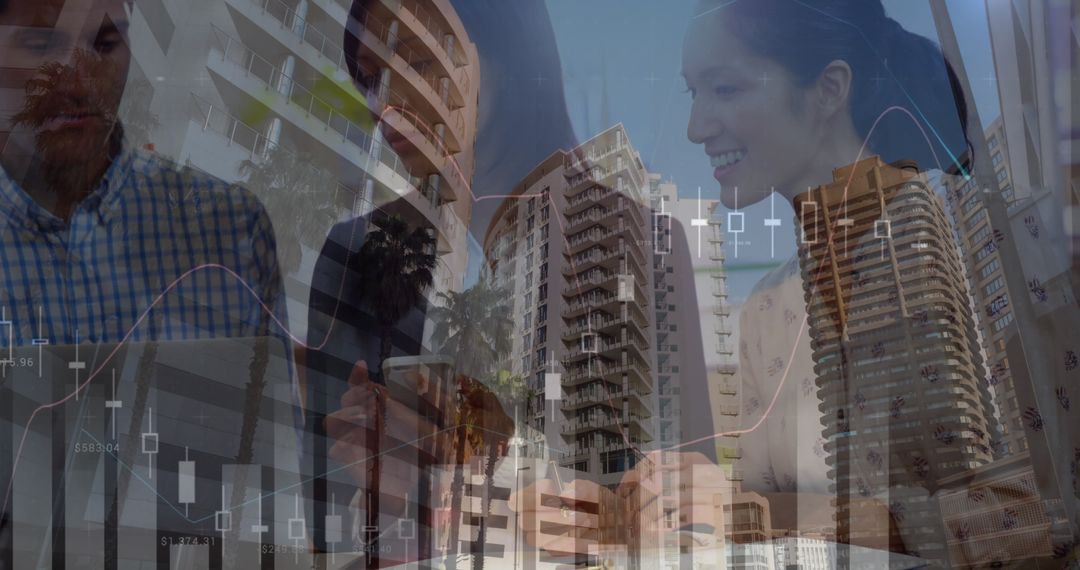
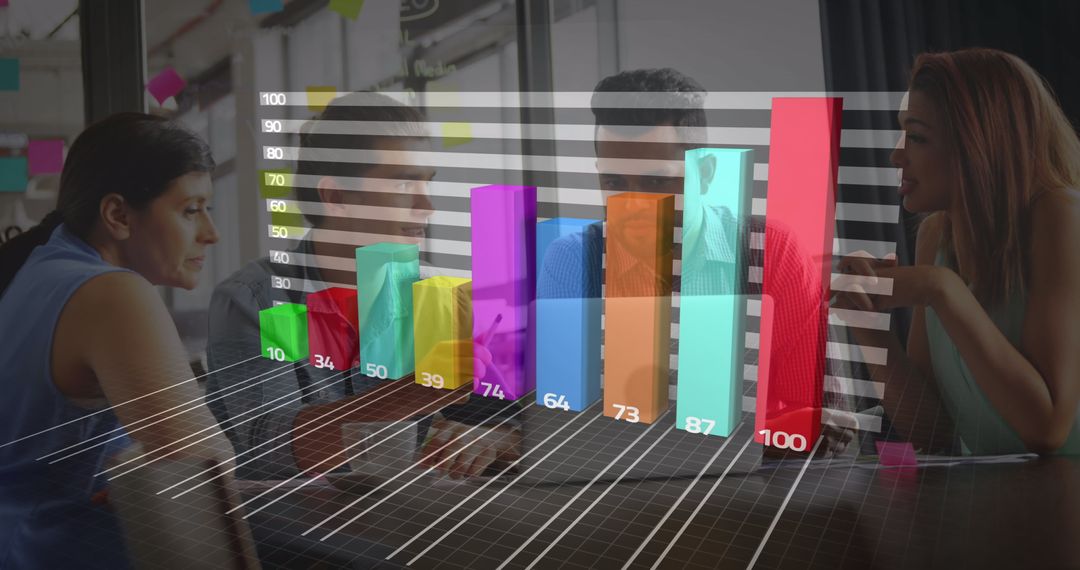
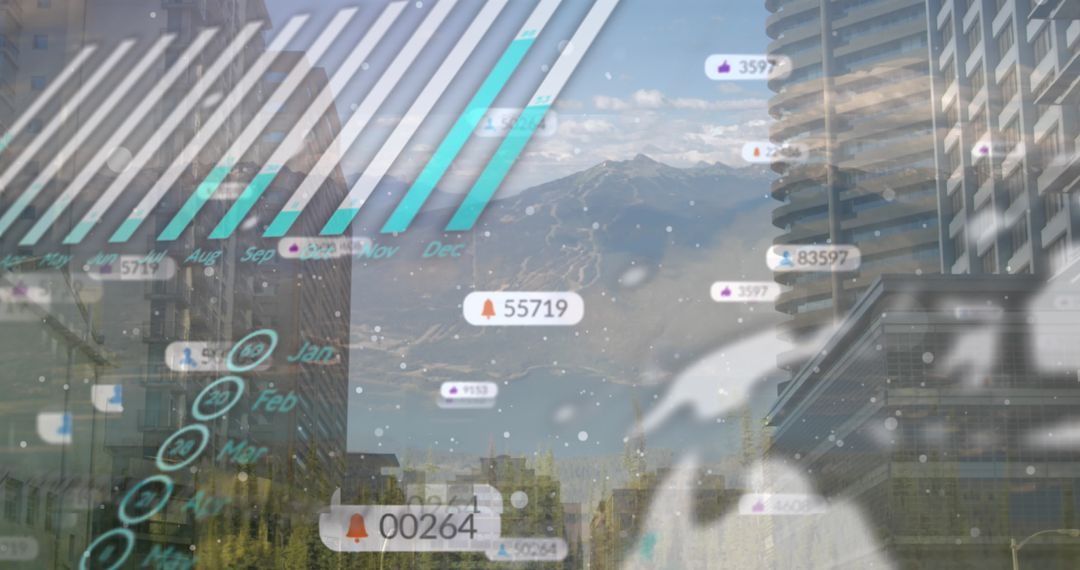
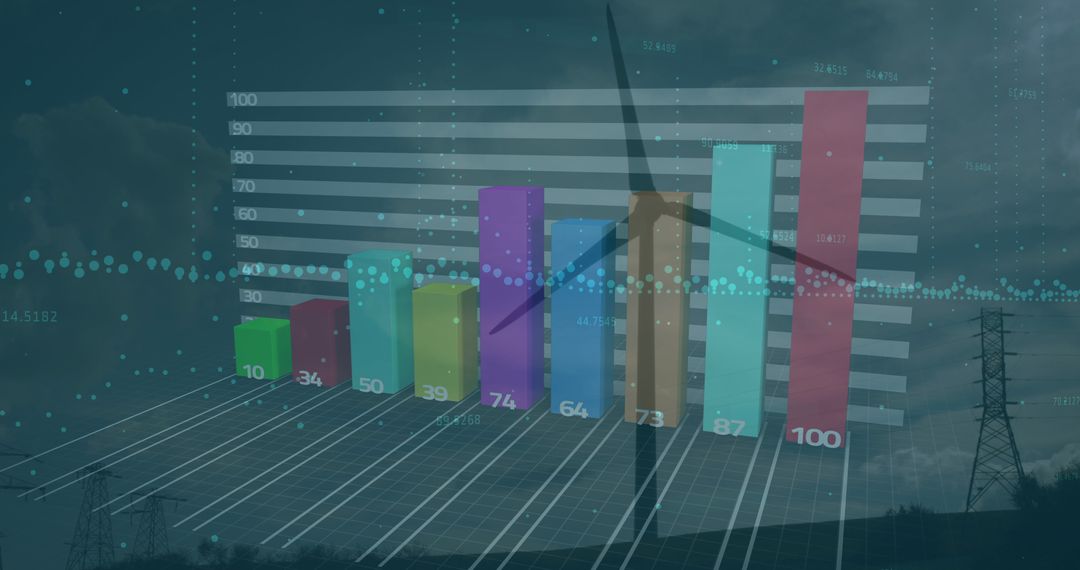
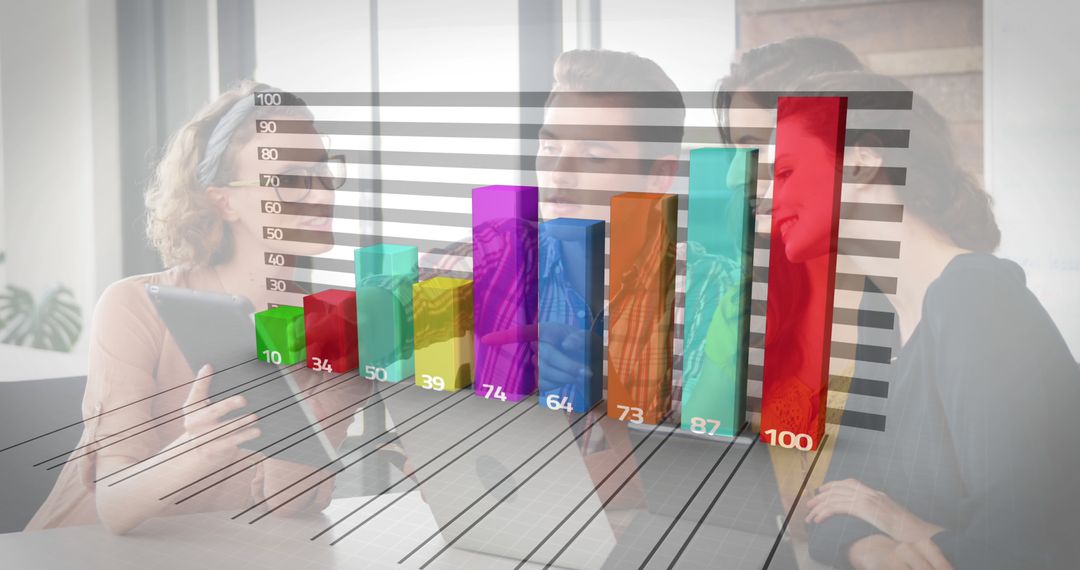
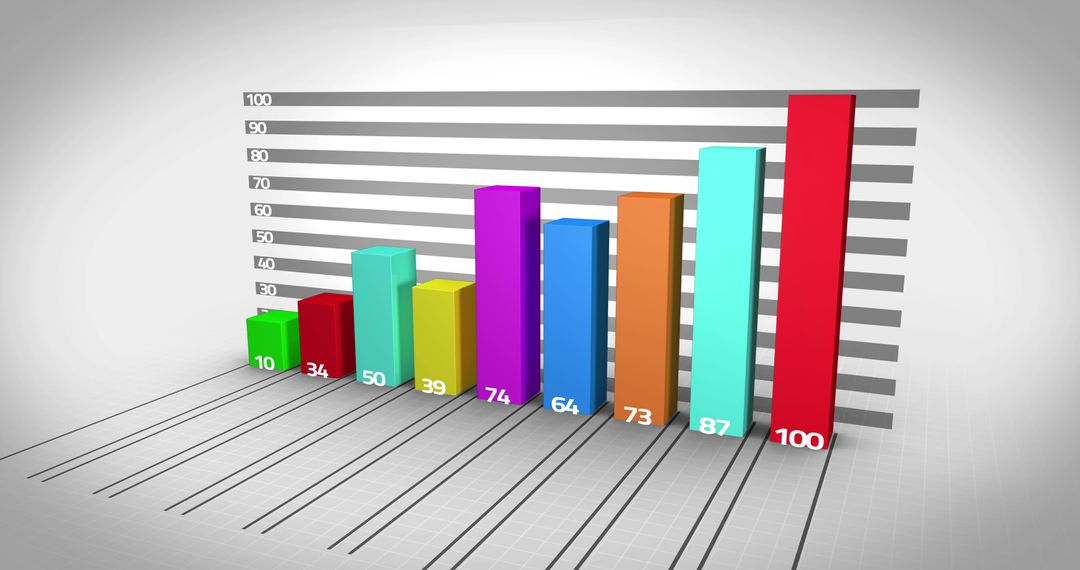
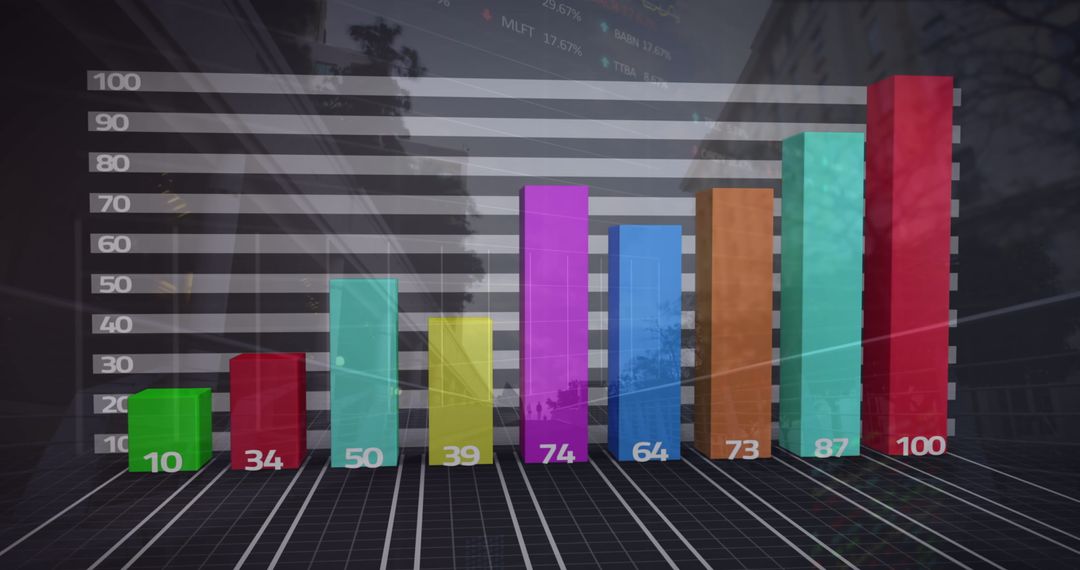
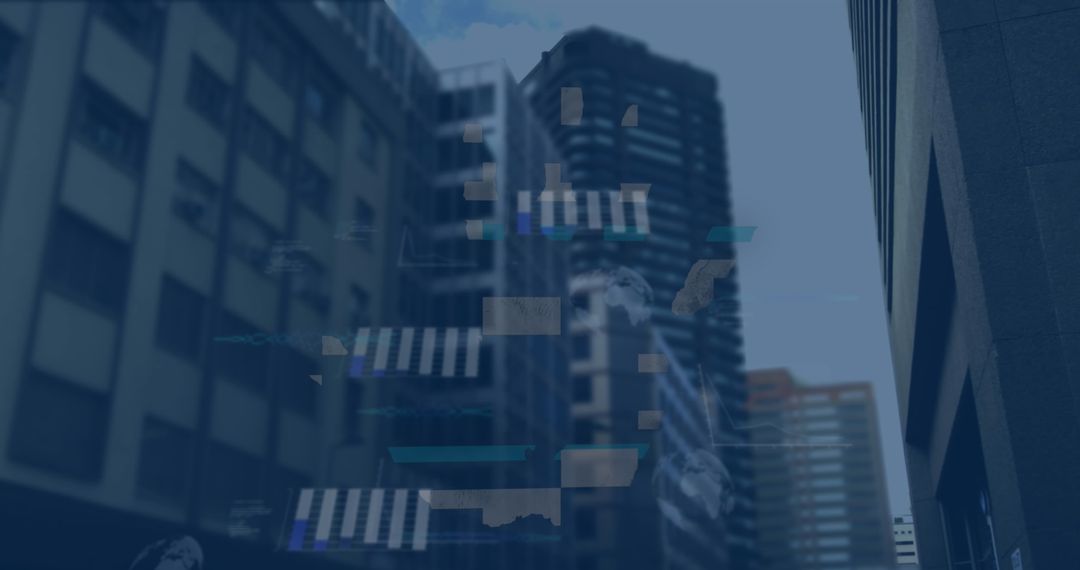
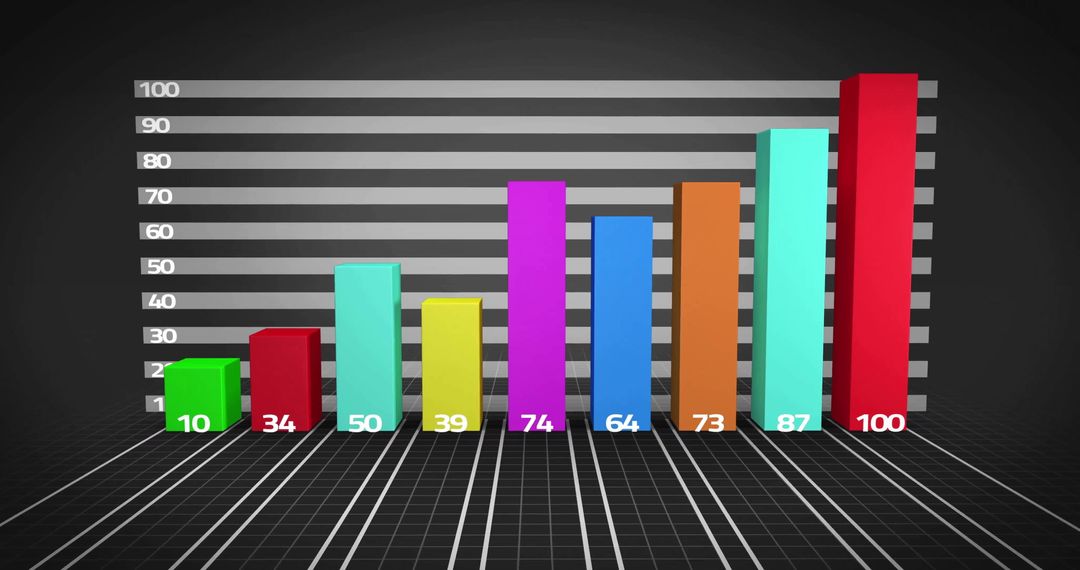
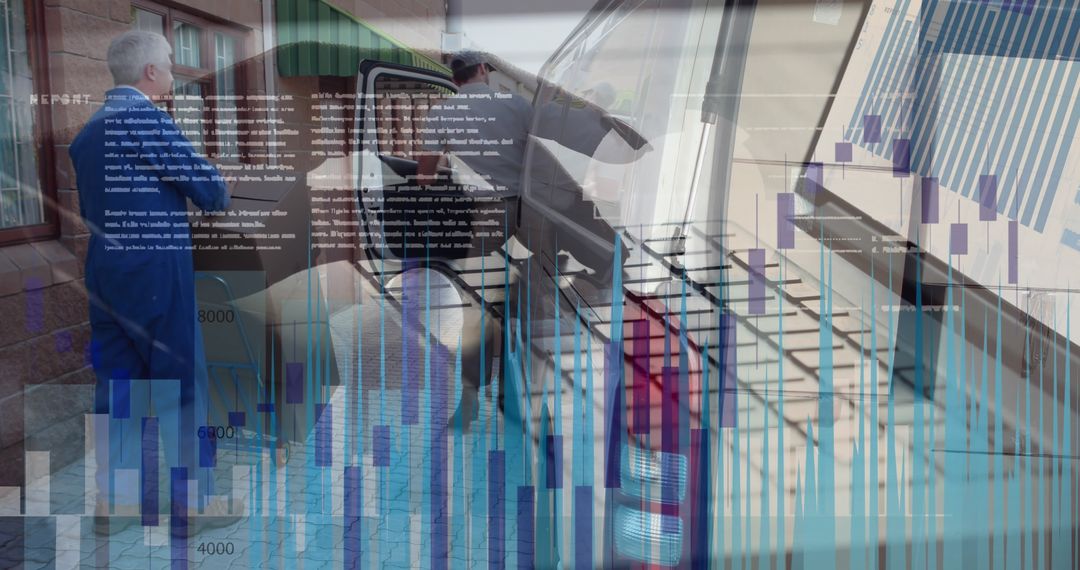
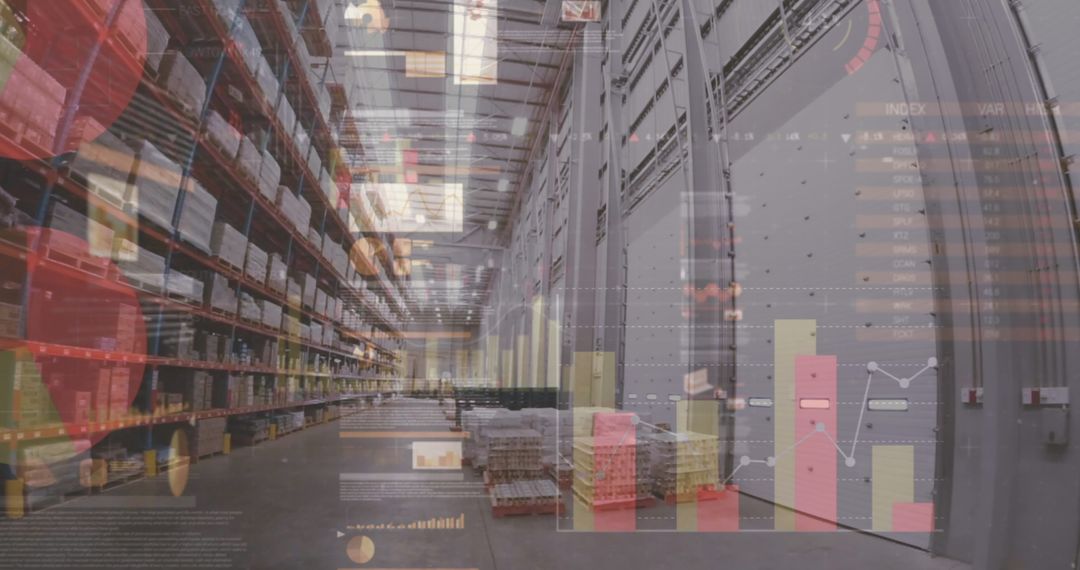
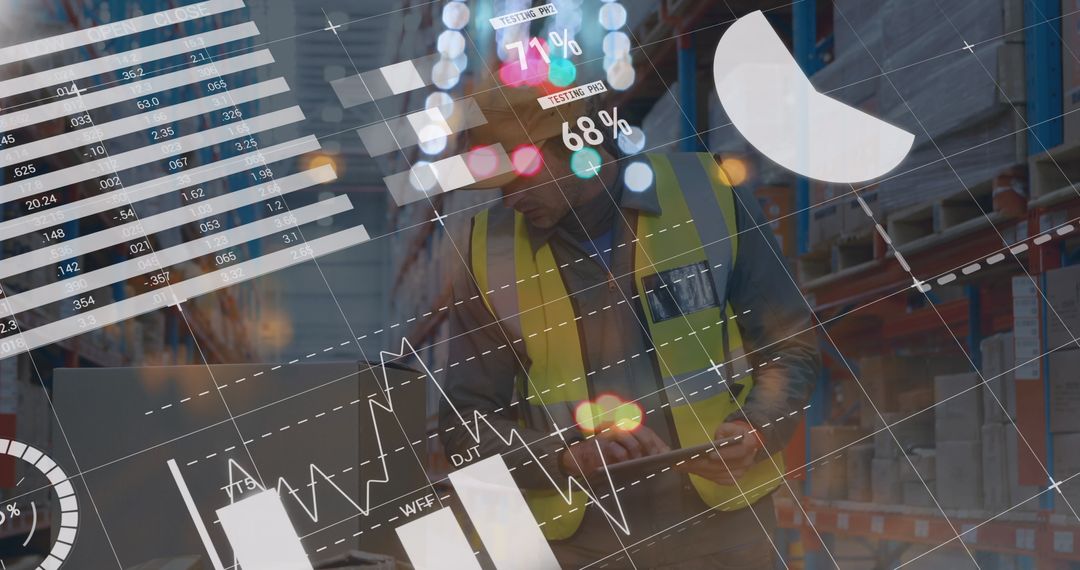
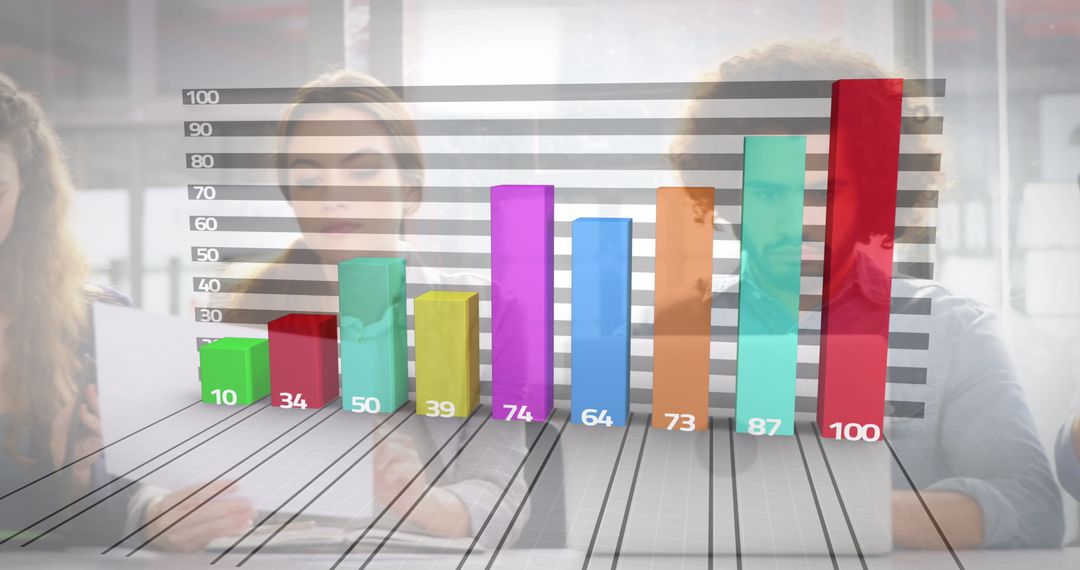
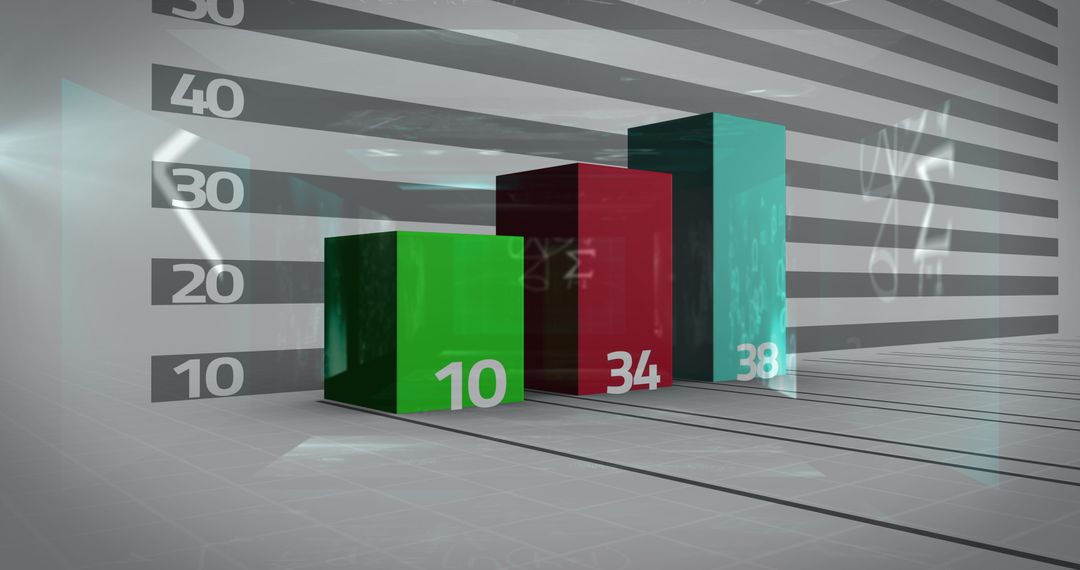
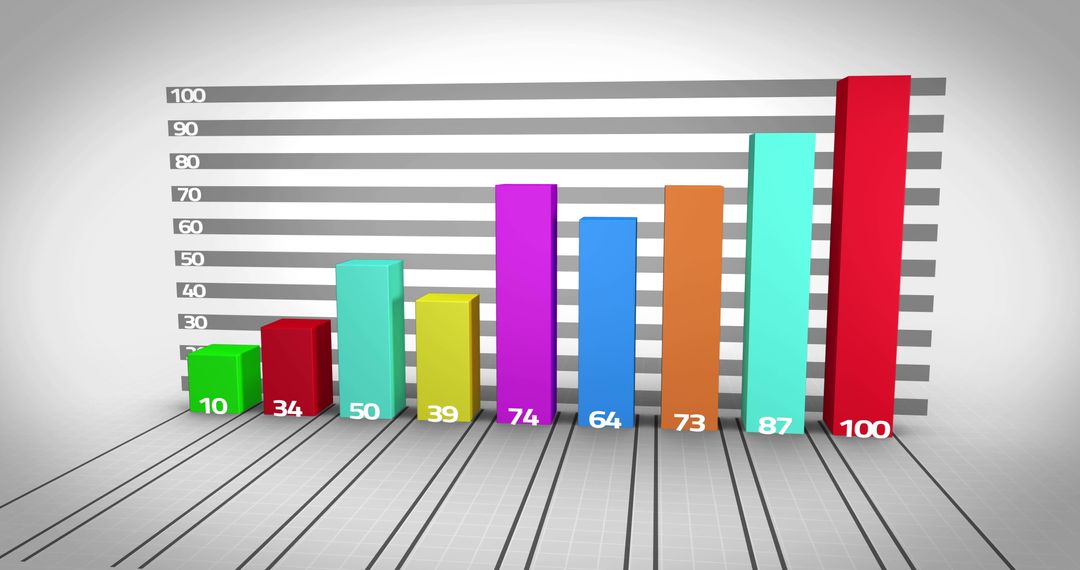
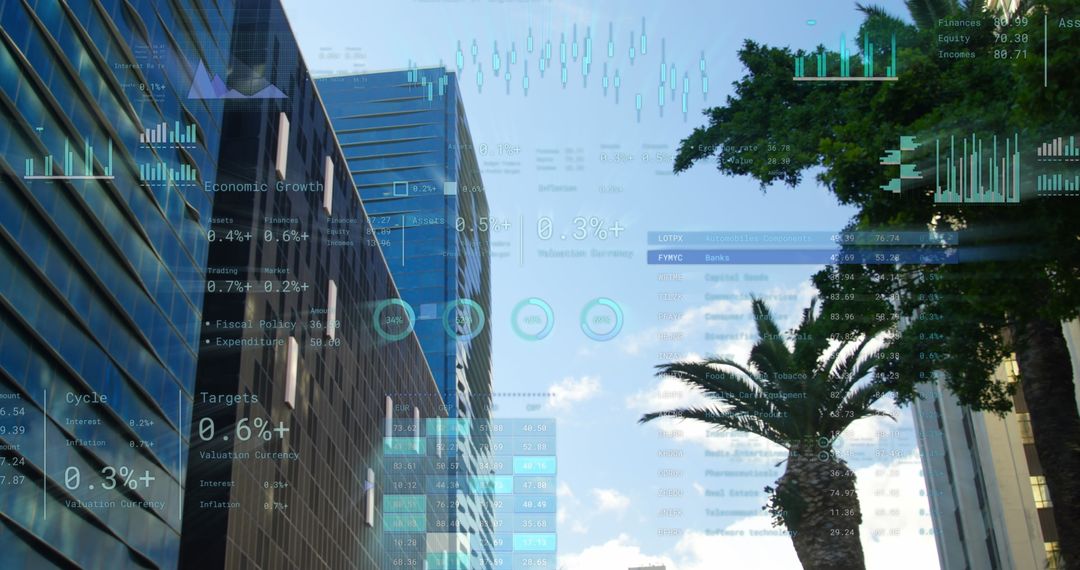
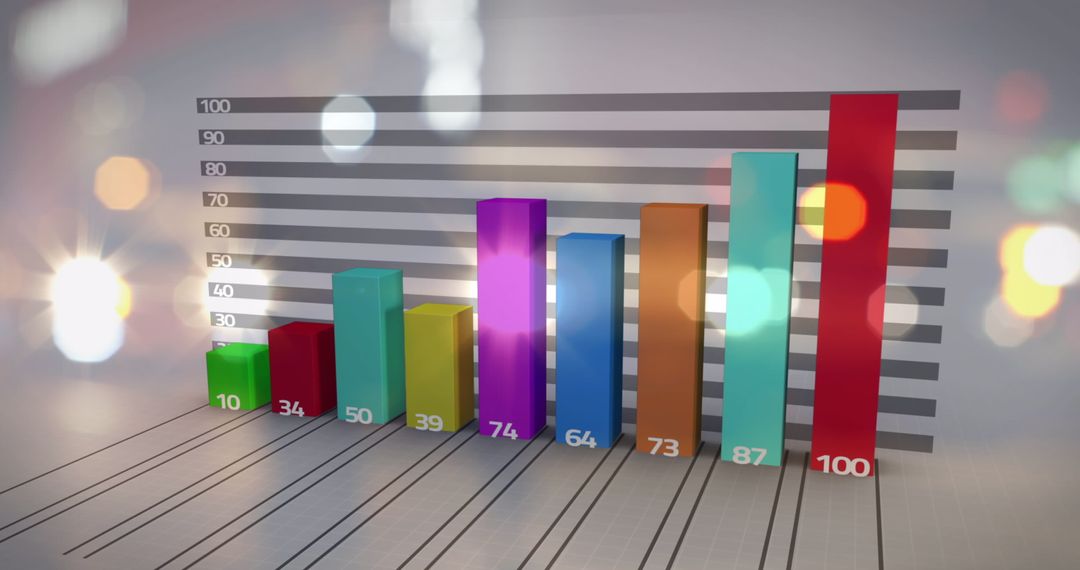
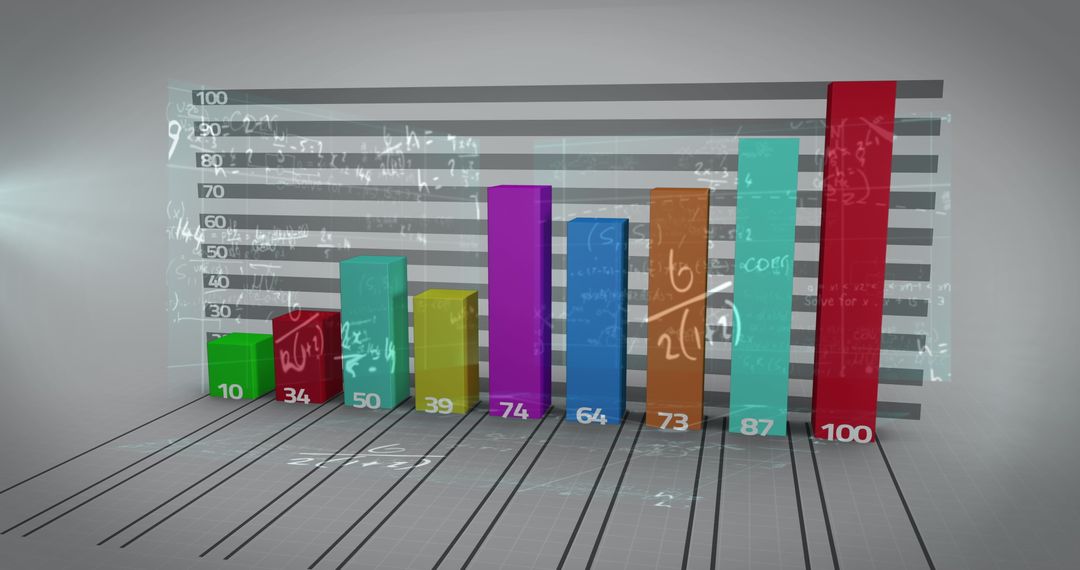
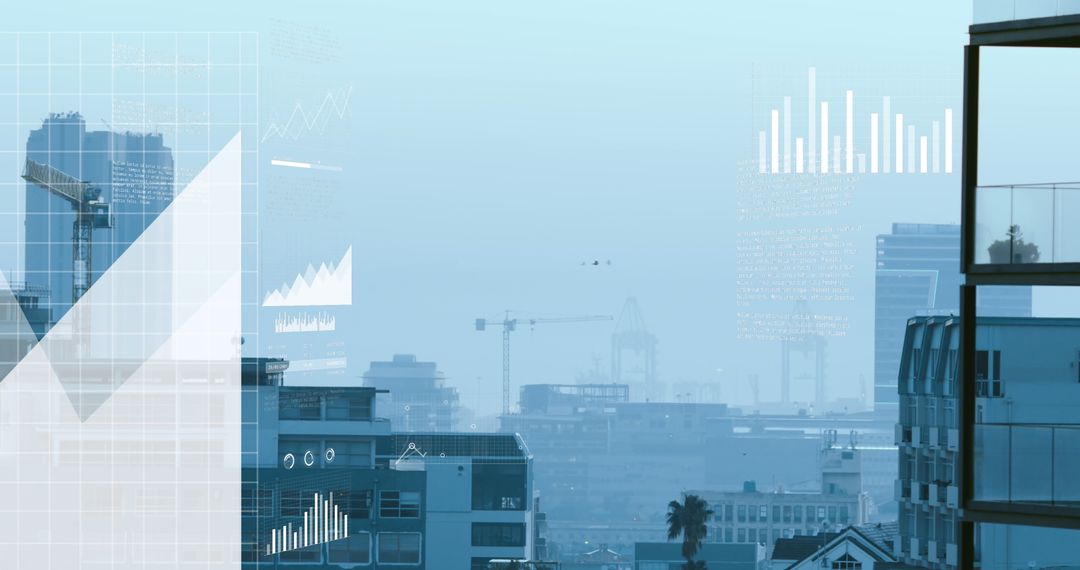
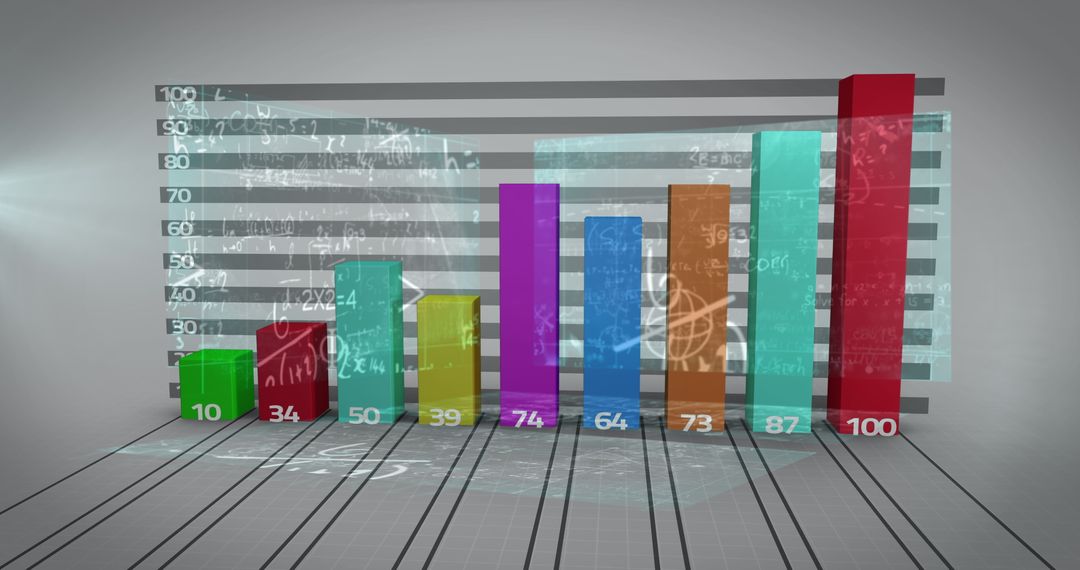
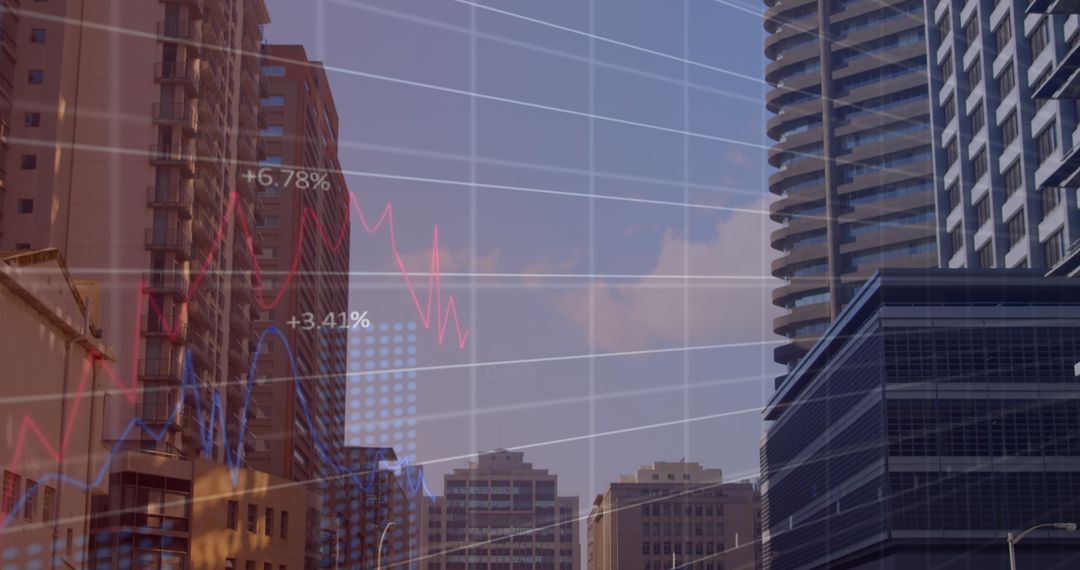
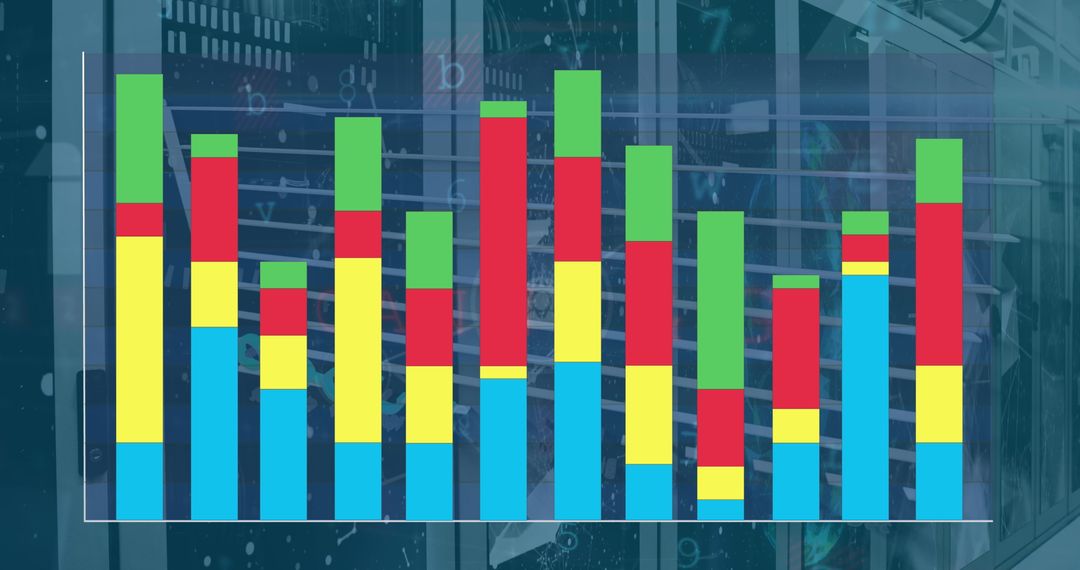
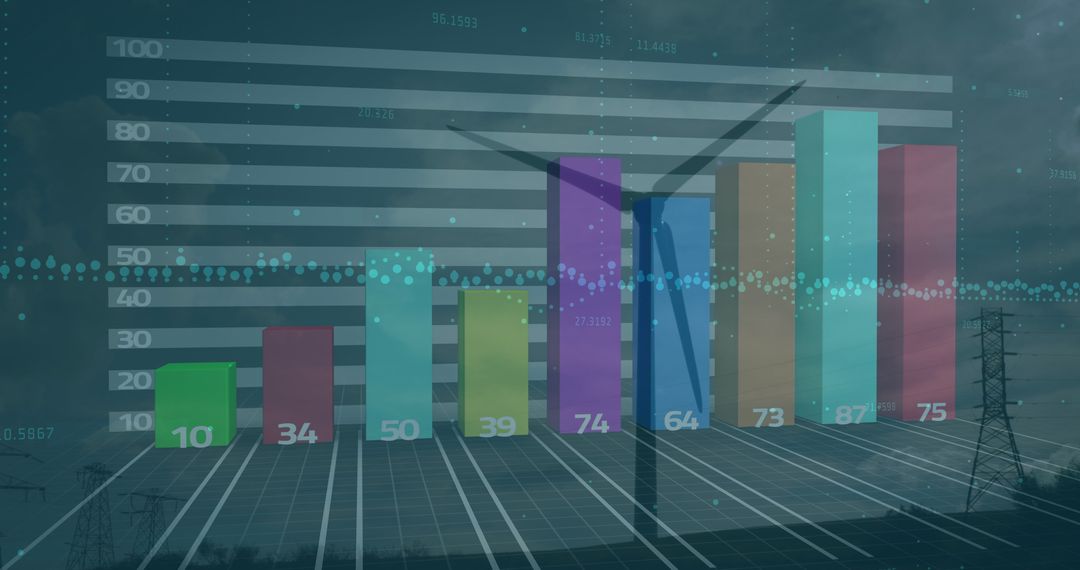
- 3D Bar Chart Integrating with Modern Cityscape Background
3D Bar Chart Integrating with Modern Cityscape Background Image
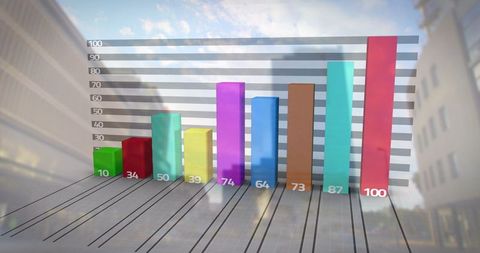
This image combines a futuristic 3D bar chart with an urban cityscape as a background, making it suitable for presentations or articles about technology-driven finance, economic analyses, or urban development strategies. The digital integration suggests themes of modern data analysis and the intersection of finance with technology and city planning.
Powered by  - Get 15% off with code: PIKWIZARD15


0
downloads
downloads
Tags:
More
Credit Photo
If you would like to credit the Photo, here are some ways you can do so
Text Link
photo Link
<span class="text-link">
<span>
<a target="_blank" href=https://pikwizard.com/photo/3d-bar-chart-integrating-with-modern-cityscape-background/b9ff5bc9ab21a307c36c0c3b10ca709a/>PikWizard</a>
</span>
</span>
<span class="image-link">
<span
style="margin: 0 0 20px 0; display: inline-block; vertical-align: middle; width: 100%;"
>
<a
target="_blank"
href="https://pikwizard.com/photo/3d-bar-chart-integrating-with-modern-cityscape-background/b9ff5bc9ab21a307c36c0c3b10ca709a/"
style="text-decoration: none; font-size: 10px; margin: 0;"
>
<img src="https://pikwizard.com/pw/medium/b9ff5bc9ab21a307c36c0c3b10ca709a.jpg" style="margin: 0; width: 100%;" alt="" />
<p style="font-size: 12px; margin: 0;">PikWizard</p>
</a>
</span>
</span>
Free (free of charge)
Free for personal and commercial use.
Author: Creative Art
Similar Free Stock Images
Premium


Premium