- Home >
- Stock Photos >
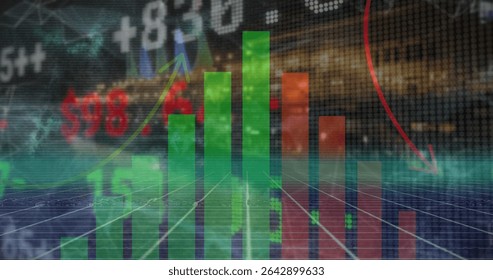
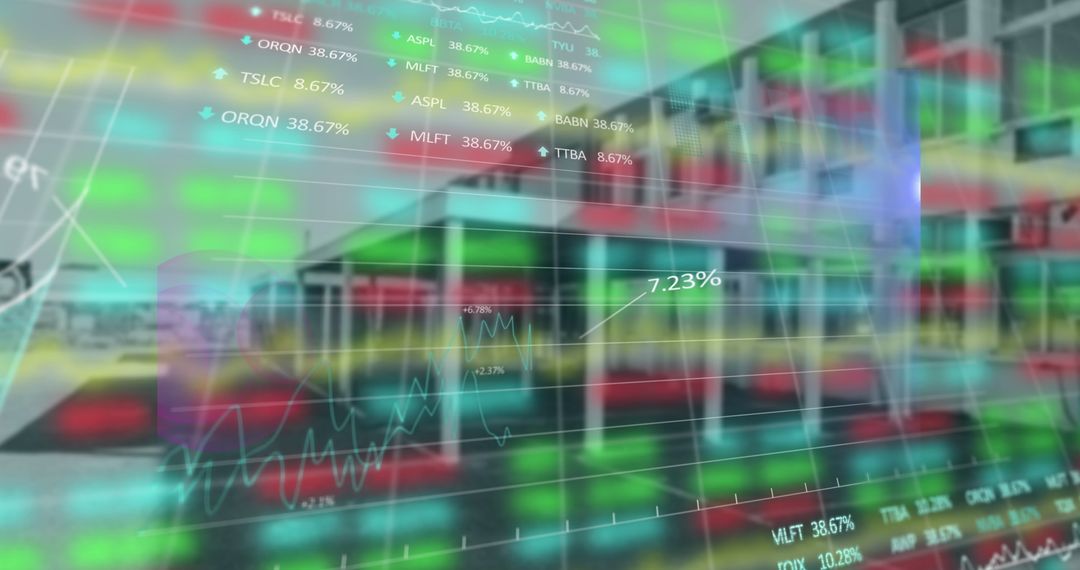
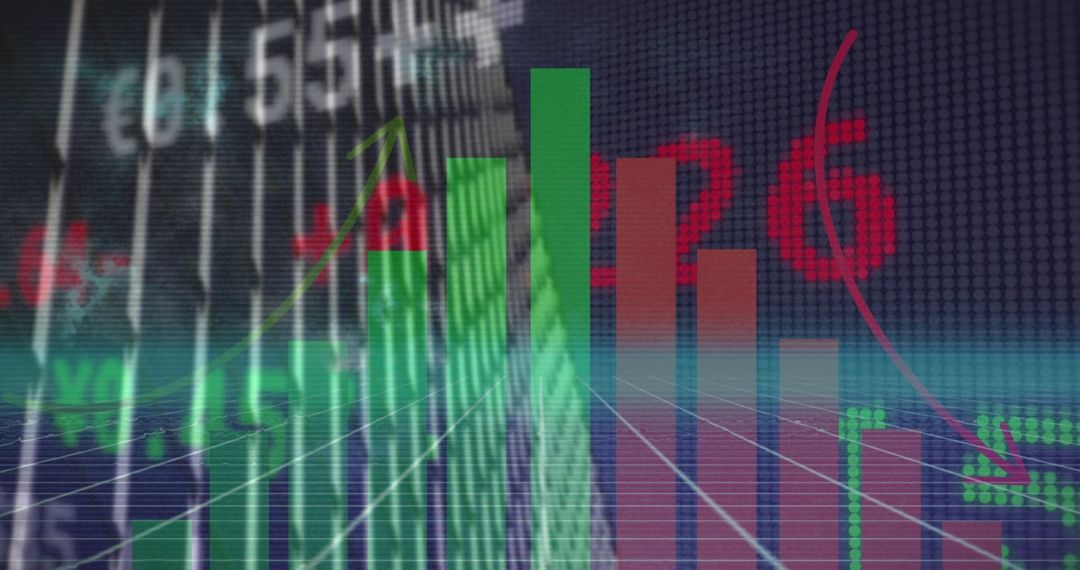
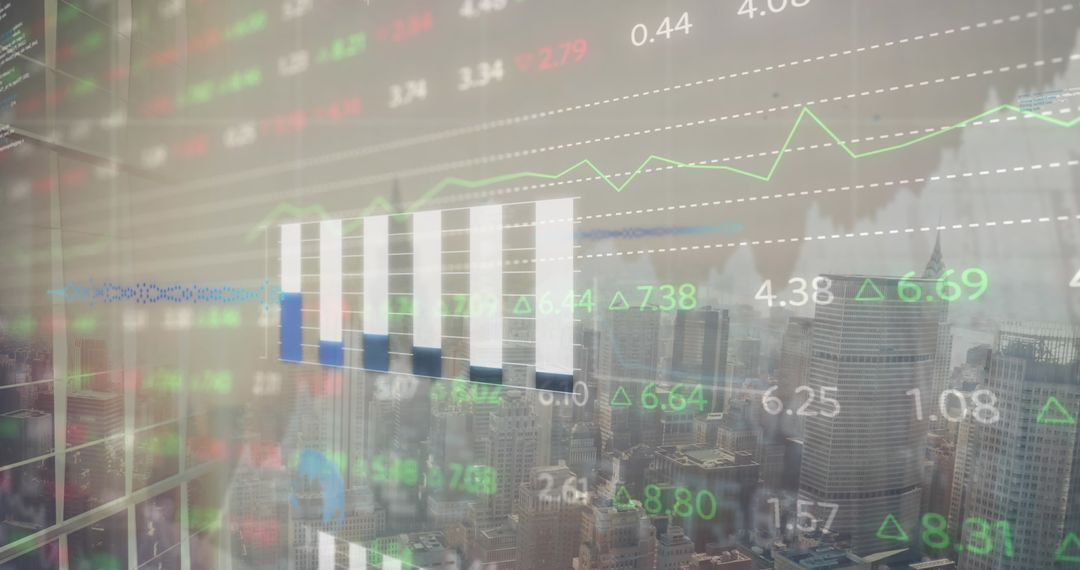
- 3D Bar Chart on Financial Trading Dashboard
3D Bar Chart on Financial Trading Dashboard Image

Illustration of translucent 3D bar chart in robust financial trading interface with overlay of trend arrows and market indicators. This visual, depicting upward and downward movements, serves as an effective tool for presentations or reports related to stock market analysis, business performance, or data-driven decision making in investment sectors.
Powered by  - Get 15% off with code: PIKWIZARD15


2
downloads
downloads
Tags:
More
Credit Photo
If you would like to credit the Photo, here are some ways you can do so
Text Link
photo Link
<span class="text-link">
<span>
<a target="_blank" href=https://pikwizard.com/photo/3d-bar-chart-on-financial-trading-dashboard/30346e02e7d8c29a13ba4925deb707bc/>PikWizard</a>
</span>
</span>
<span class="image-link">
<span
style="margin: 0 0 20px 0; display: inline-block; vertical-align: middle; width: 100%;"
>
<a
target="_blank"
href="https://pikwizard.com/photo/3d-bar-chart-on-financial-trading-dashboard/30346e02e7d8c29a13ba4925deb707bc/"
style="text-decoration: none; font-size: 10px; margin: 0;"
>
<img src="https://pikwizard.com/pw/medium/30346e02e7d8c29a13ba4925deb707bc.jpg" style="margin: 0; width: 100%;" alt="" />
<p style="font-size: 12px; margin: 0;">PikWizard</p>
</a>
</span>
</span>
Free (free of charge)
Free for personal and commercial use.
Author: Awesome Content
Similar Free Stock Images

Premium


Premium


Premium


Premium


Premium


Premium


Premium


Premium


Premium


Premium


Premium


Premium


Premium


Premium


Premium


Premium


Premium


Premium


Premium


Premium


Premium


Premium


Premium