
- Home >
- Stock Photos >
- 3D Bar Chart Over Grassy Valley for Data Analytics
3D Bar Chart Over Grassy Valley for Data Analytics Image
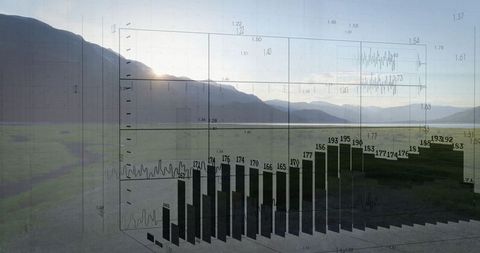
Concept of blending technology with nature by depicting a transparent 3D bar chart floating over a grass landscape in a valley. Numbers, charts, and visual data reinforce themes of modern analytics and digital landscape merging with natural environments. Ideal for representing big data processing in technology firms, innovative imaging in tech advertisements, or educational visuals for data analytics.
Powered by 


2
downloads
downloads
Tags:
More
Credit Photo
If you would like to credit the Photo, here are some ways you can do so
Text Link
photo Link
<span class="text-link">
<span>
<a target="_blank" href=https://pikwizard.com/photo/3d-bar-chart-over-grassy-valley-for-data-analytics/931b67636352c7085bf18a47c1d8f6c7/>PikWizard</a>
</span>
</span>
<span class="image-link">
<span
style="margin: 0 0 20px 0; display: inline-block; vertical-align: middle; width: 100%;"
>
<a
target="_blank"
href="https://pikwizard.com/photo/3d-bar-chart-over-grassy-valley-for-data-analytics/931b67636352c7085bf18a47c1d8f6c7/"
style="text-decoration: none; font-size: 10px; margin: 0;"
>
<img src="https://pikwizard.com/pw/medium/931b67636352c7085bf18a47c1d8f6c7.jpg" style="margin: 0; width: 100%;" alt="" />
<p style="font-size: 12px; margin: 0;">PikWizard</p>
</a>
</span>
</span>
Free (free of charge)
Free for personal and commercial use.
Author: Awesome Content