
- Home >
- Stock Photos >
- 3D Bar Chart Overlaying Wind Farm at Horizon with Data Visualization
3D Bar Chart Overlaying Wind Farm at Horizon with Data Visualization Image
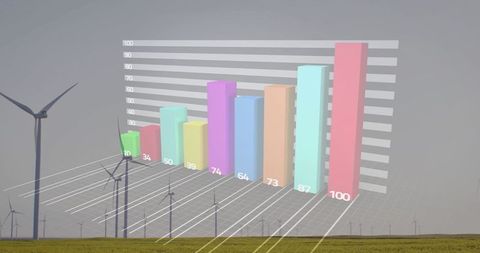
The 3D bar chart overlays a wind farm, illustrating data visualization in the context of renewable energy. The colorful bars represent varying metrics, making it ideal for presentations on renewable energy, sustainability initiatives, or data analytics. Can be used in reports or articles emphasizing innovation in eco-friendly technology and environmental data assessments.
Powered by  - Get 15% off with code: PIKWIZARD15


0
downloads
downloads
Tags:
More
Credit Photo
If you would like to credit the Photo, here are some ways you can do so
Text Link
photo Link
<span class="text-link">
<span>
<a target="_blank" href=https://pikwizard.com/photo/3d-bar-chart-overlaying-wind-farm-at-horizon-with-data-visualization/288ab6a459b210aa18784af482f5b77a/>PikWizard</a>
</span>
</span>
<span class="image-link">
<span
style="margin: 0 0 20px 0; display: inline-block; vertical-align: middle; width: 100%;"
>
<a
target="_blank"
href="https://pikwizard.com/photo/3d-bar-chart-overlaying-wind-farm-at-horizon-with-data-visualization/288ab6a459b210aa18784af482f5b77a/"
style="text-decoration: none; font-size: 10px; margin: 0;"
>
<img src="https://pikwizard.com/pw/medium/288ab6a459b210aa18784af482f5b77a.jpg" style="margin: 0; width: 100%;" alt="" />
<p style="font-size: 12px; margin: 0;">PikWizard</p>
</a>
</span>
</span>
Free (free of charge)
Free for personal and commercial use.
Author: Authentic Images