- Home >
- Stock Photos >
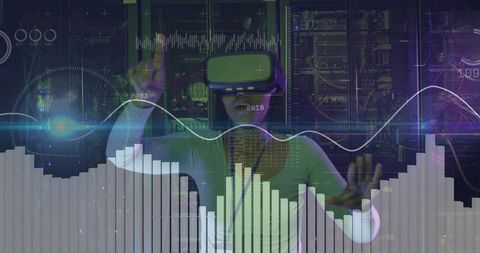
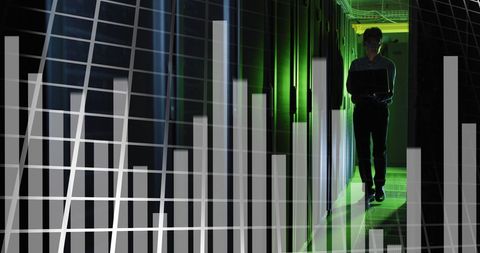
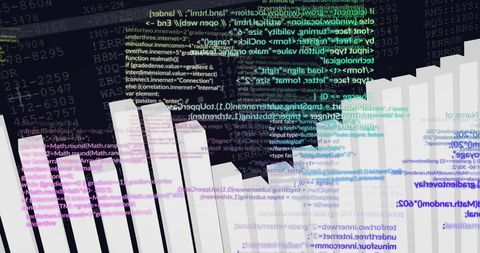
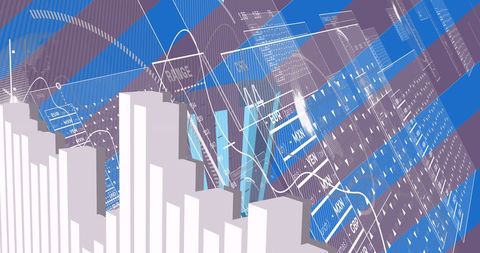
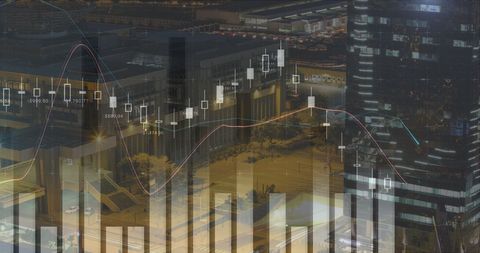
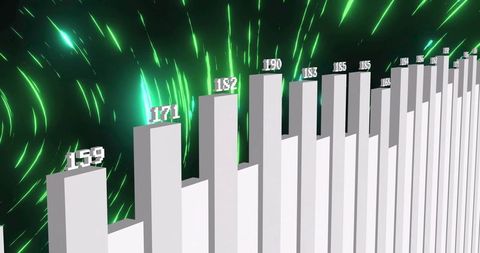
- 3D Bar Chart Visualization Inside Innovative Data Center
3D Bar Chart Visualization Inside Innovative Data Center Image

Modern data center features emerging 3D bar chart model within corridor dotted by server racks, emphasizing technology and analytics. Ideal for tech blogs, business strategy presentations, and visual stories about data management and digital innovation strategies.

downloads
Tags:
More
Credit Photo
If you would like to credit the Photo, here are some ways you can do so
Text Link
photo Link
<span class="text-link">
<span>
<a target="_blank" href=https://pikwizard.com/photo/3d-bar-chart-visualization-inside-innovative-data-center/289c332db43532fe17a67125f05a44cd/>PikWizard</a>
</span>
</span>
<span class="image-link">
<span
style="margin: 0 0 20px 0; display: inline-block; vertical-align: middle; width: 100%;"
>
<a
target="_blank"
href="https://pikwizard.com/photo/3d-bar-chart-visualization-inside-innovative-data-center/289c332db43532fe17a67125f05a44cd/"
style="text-decoration: none; font-size: 10px; margin: 0;"
>
<img src="https://pikwizard.com/pw/medium/289c332db43532fe17a67125f05a44cd.jpg" style="margin: 0; width: 100%;" alt="" />
<p style="font-size: 12px; margin: 0;">PikWizard</p>
</a>
</span>
</span>
Free (free of charge)
Free for personal and commercial use.
Author: Creative Art