
- Home >
- Stock Photos >
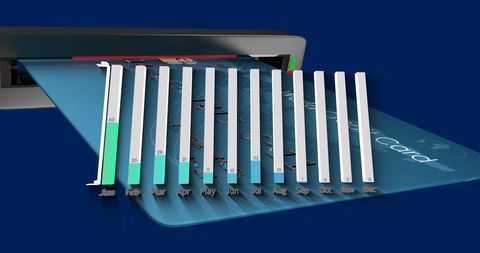
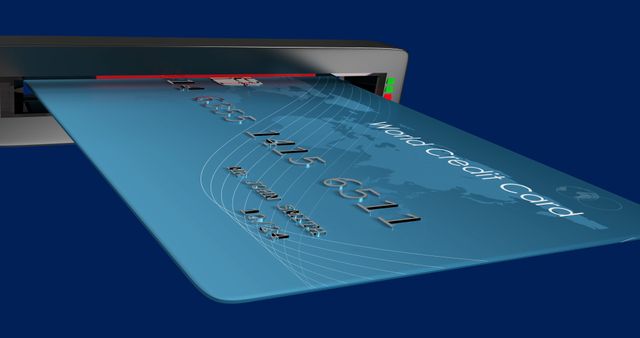
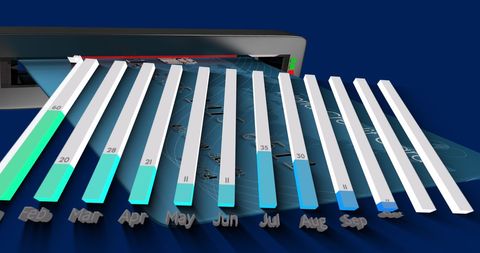
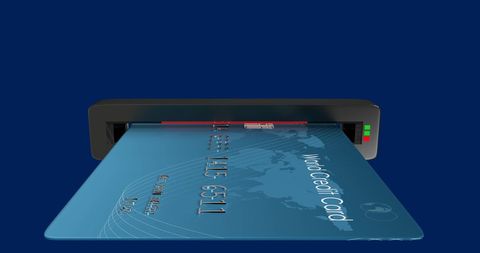
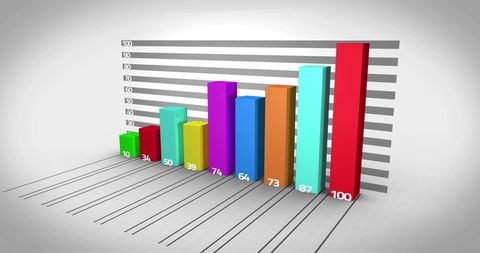
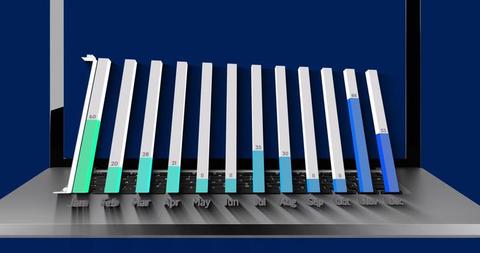
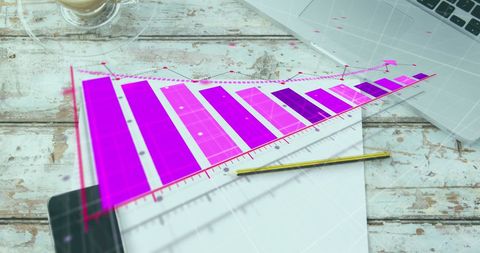
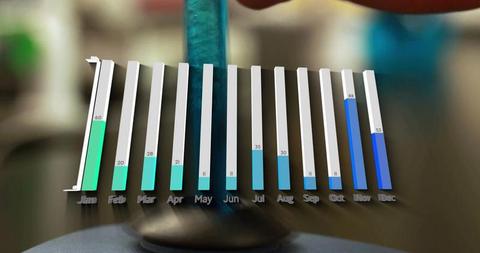
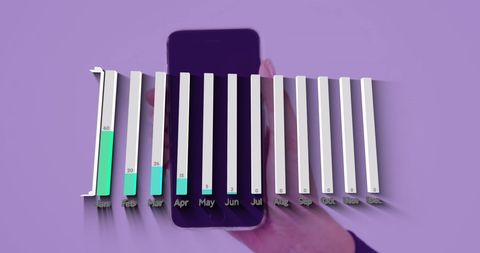
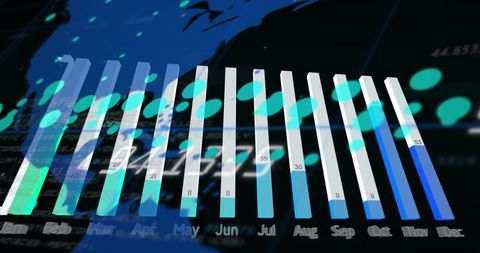
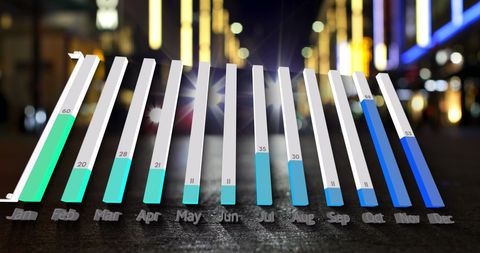
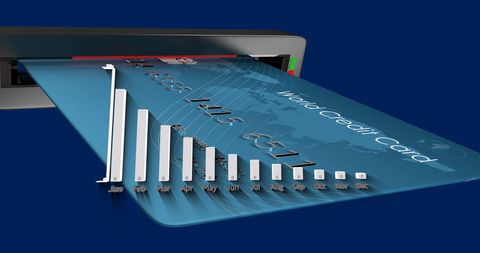
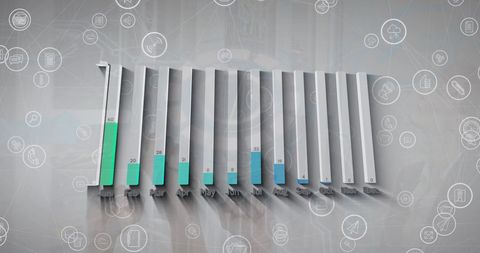
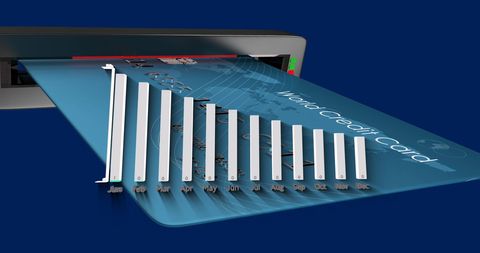
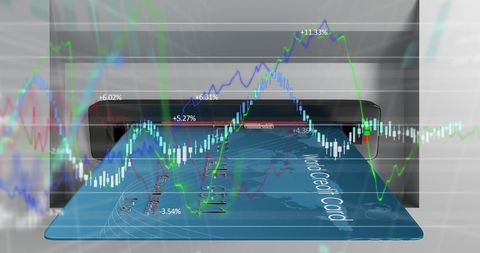
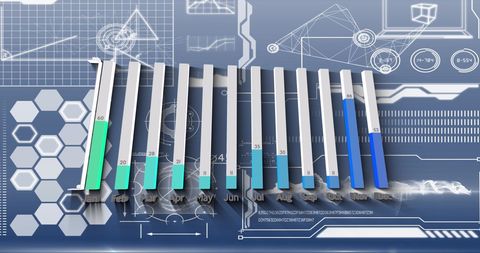
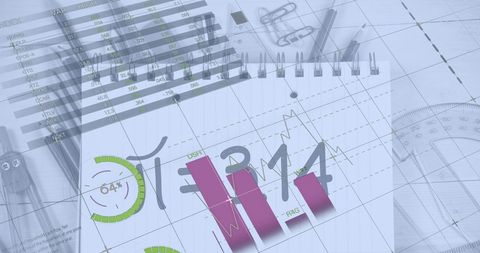
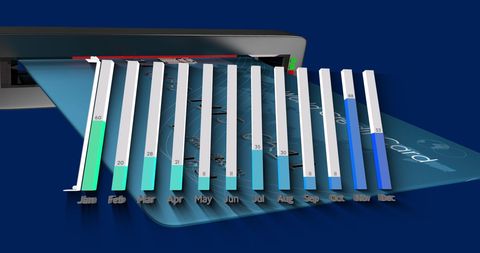
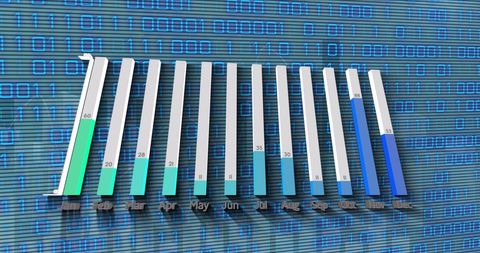
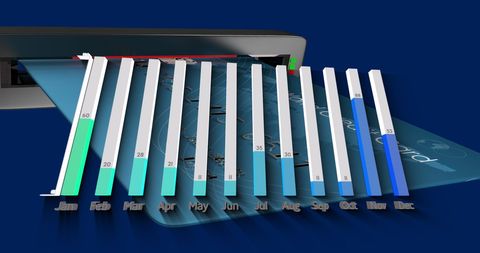
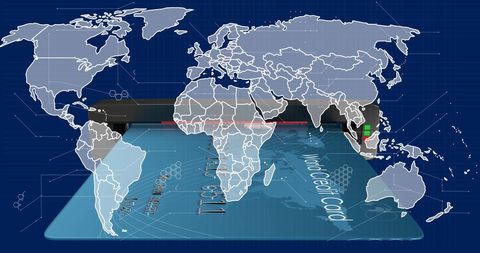
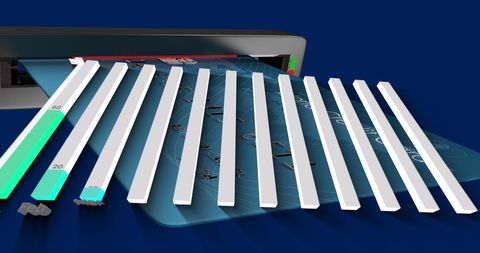
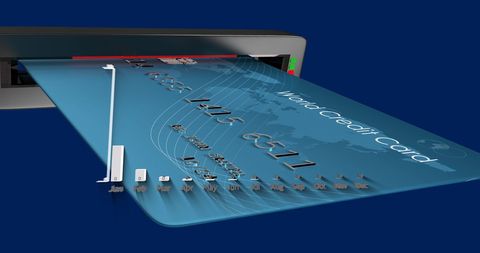
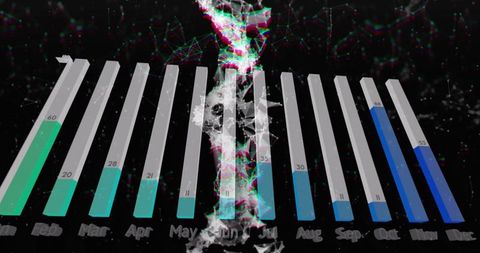
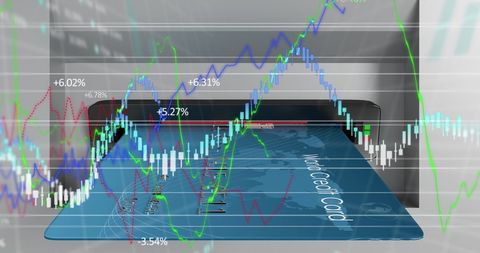
- 3D Bar Chart with Electronic Card Payment Interface
3D Bar Chart with Electronic Card Payment Interface Image
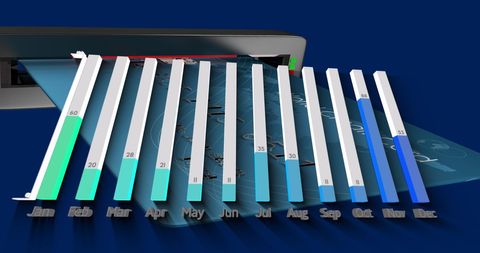
Three-dimensional bar chart demonstrates monthly data trends overlaid on electronic card payment interface, ideal for illustrating concepts in finance, technology advancements, or presenting business analytics in modern and dynamic format for reports, presentations, websites.
Powered by  - Get 15% off with code: PIKWIZARD15


downloads
Tags:
More
Credit Photo
If you would like to credit the Photo, here are some ways you can do so
Text Link
photo Link
<span class="text-link">
<span>
<a target="_blank" href=https://pikwizard.com/photo/3d-bar-chart-with-electronic-card-payment-interface/aebdffb454c8badcf3ee1489ab30275b/>PikWizard</a>
</span>
</span>
<span class="image-link">
<span
style="margin: 0 0 20px 0; display: inline-block; vertical-align: middle; width: 100%;"
>
<a
target="_blank"
href="https://pikwizard.com/photo/3d-bar-chart-with-electronic-card-payment-interface/aebdffb454c8badcf3ee1489ab30275b/"
style="text-decoration: none; font-size: 10px; margin: 0;"
>
<img src="https://pikwizard.com/pw/medium/aebdffb454c8badcf3ee1489ab30275b.jpg" style="margin: 0; width: 100%;" alt="" />
<p style="font-size: 12px; margin: 0;">PikWizard</p>
</a>
</span>
</span>
Free (free of charge)
Free for personal and commercial use.
Author: Creative Art
Similar Free Stock Images
AI


Premium

Premium


Premium

Premium

Premium


Premium


Premium


AI

Premium

Premium

Premium


Premium

Premium


Premium

Premium


Premium


Premium

AI


Premium


AI

Premium


Premium


Premium


Premium

AI

Premium

Premium


Premium


Premium


Explore More Free Stock Images