
- Home >
- Stock Photos >
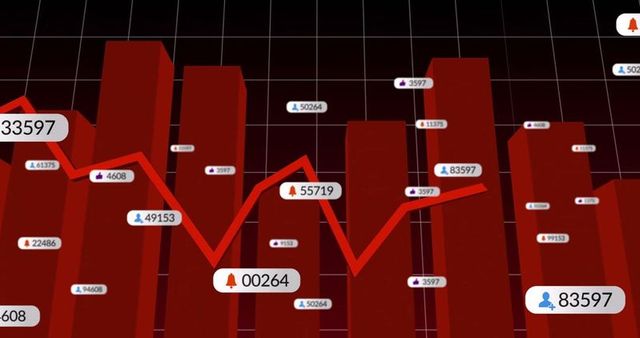
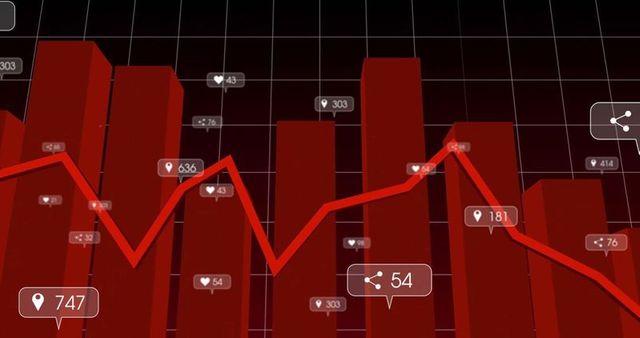
- 3D Bar Chart with Interactive Icons for Data Analytics
3D Bar Chart with Interactive Icons for Data Analytics Image
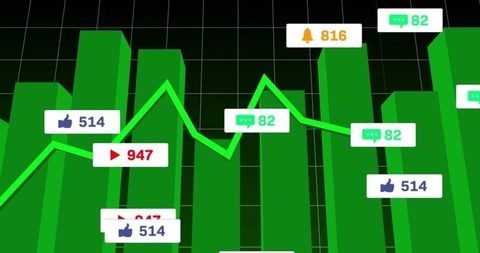
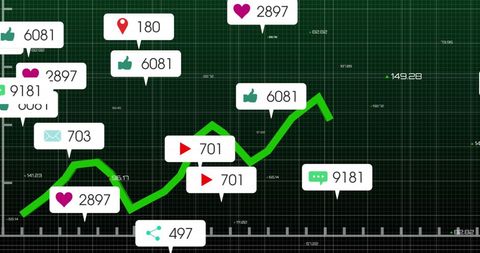
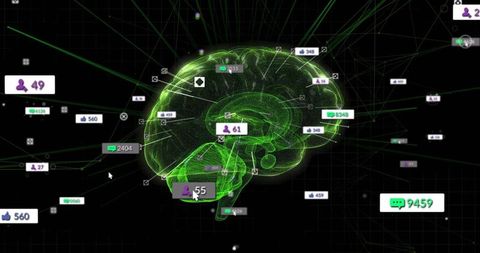
Dynamic presentation combines 3D bar chart with graphical elements like thumbs-up, play, chat, and notification bell icons. Useful for contexts such as business analytics, technology dashboards, online engagement measurement, digital marketing, data-driven presentations, and educational materials on data analysis. Its futuristic design expresses concepts in tech-savvy ways compatible with modern narratives.
Powered by 


downloads
Tags:
More
Credit Photo
If you would like to credit the Photo, here are some ways you can do so
Text Link
photo Link
<span class="text-link">
<span>
<a target="_blank" href=https://pikwizard.com/photo/3d-bar-chart-with-interactive-icons-for-data-analytics/8ba57cf59a44db9d2c75b2823f820076/>PikWizard</a>
</span>
</span>
<span class="image-link">
<span
style="margin: 0 0 20px 0; display: inline-block; vertical-align: middle; width: 100%;"
>
<a
target="_blank"
href="https://pikwizard.com/photo/3d-bar-chart-with-interactive-icons-for-data-analytics/8ba57cf59a44db9d2c75b2823f820076/"
style="text-decoration: none; font-size: 10px; margin: 0;"
>
<img src="https://pikwizard.com/pw/medium/8ba57cf59a44db9d2c75b2823f820076.jpg" style="margin: 0; width: 100%;" alt="" />
<p style="font-size: 12px; margin: 0;">PikWizard</p>
</a>
</span>
</span>
Free (free of charge)
Free for personal and commercial use.
Author: Awesome Content
Similar Free Stock Images

Premium


Premium


Premium


Premium


Premium


Premium

Premium


Premium

Premium

Premium


Premium


Premium

Premium


Premium


Premium


Premium

Premium


Premium


Premium

Premium


Premium


Premium


Premium


Premium


Premium
Explore More Free Stock Images