
- Home >
- Stock Photos >
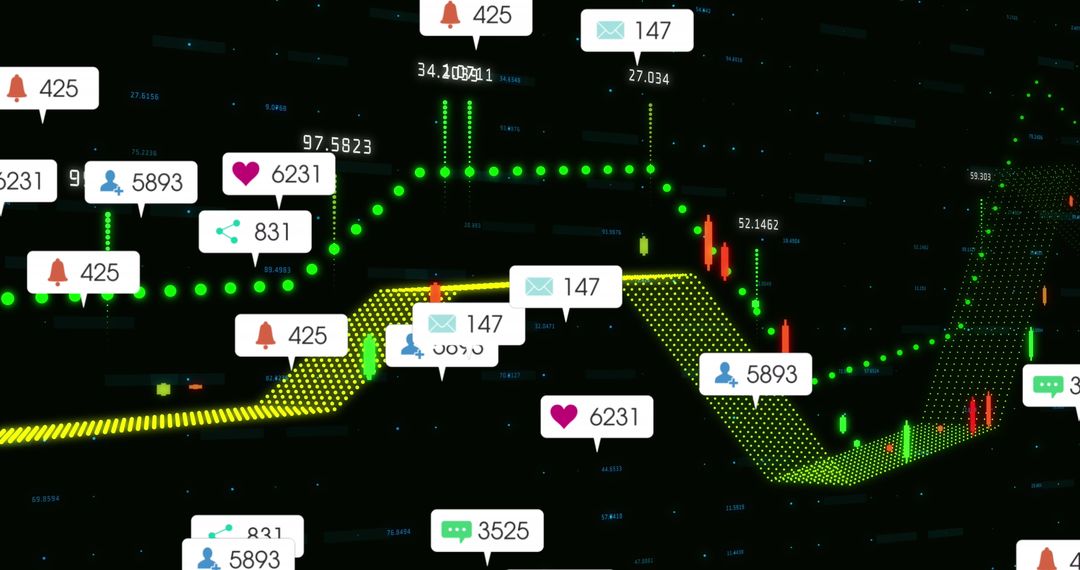
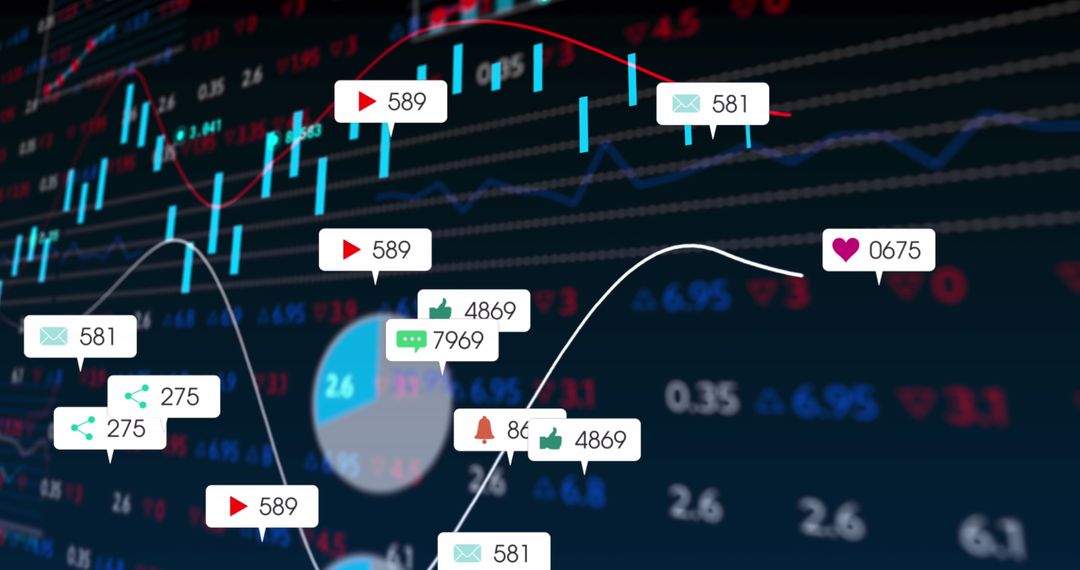
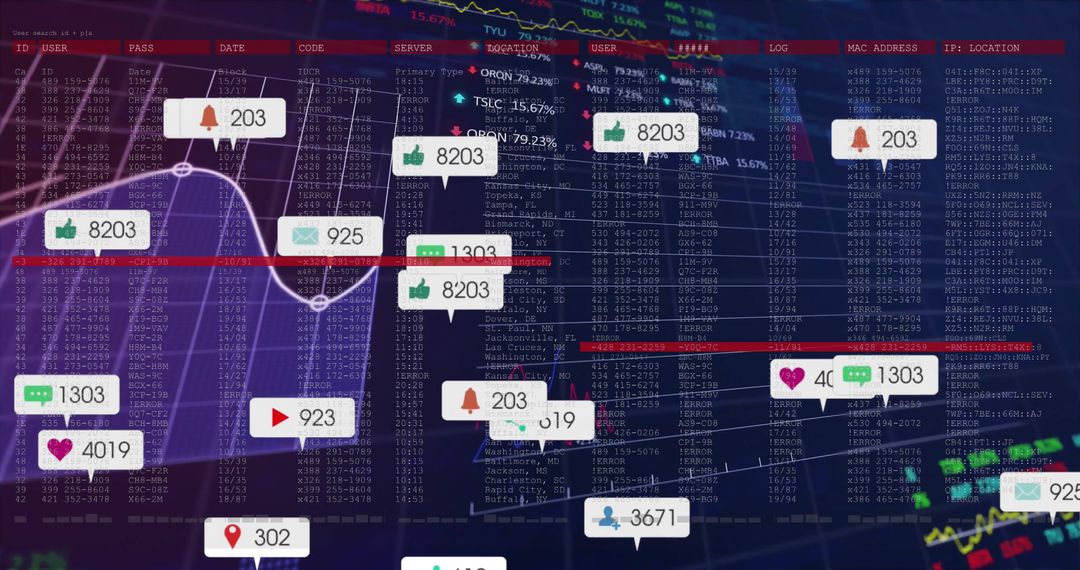
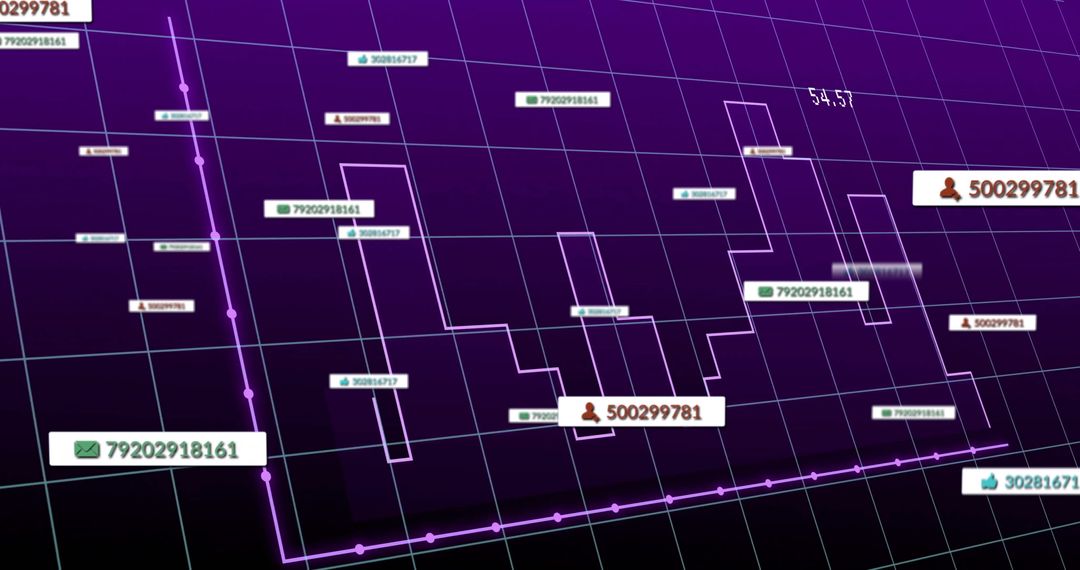
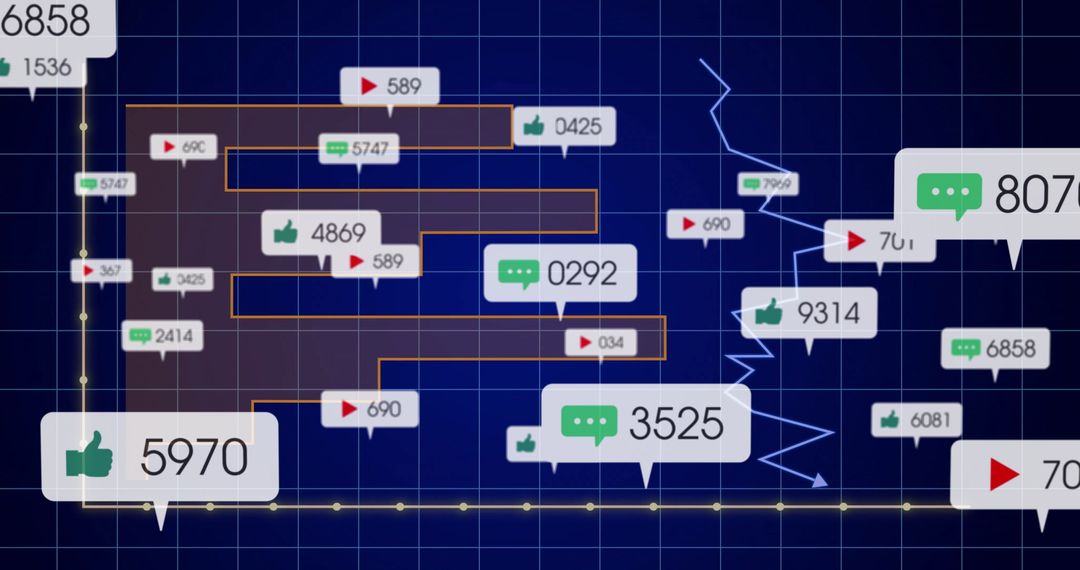
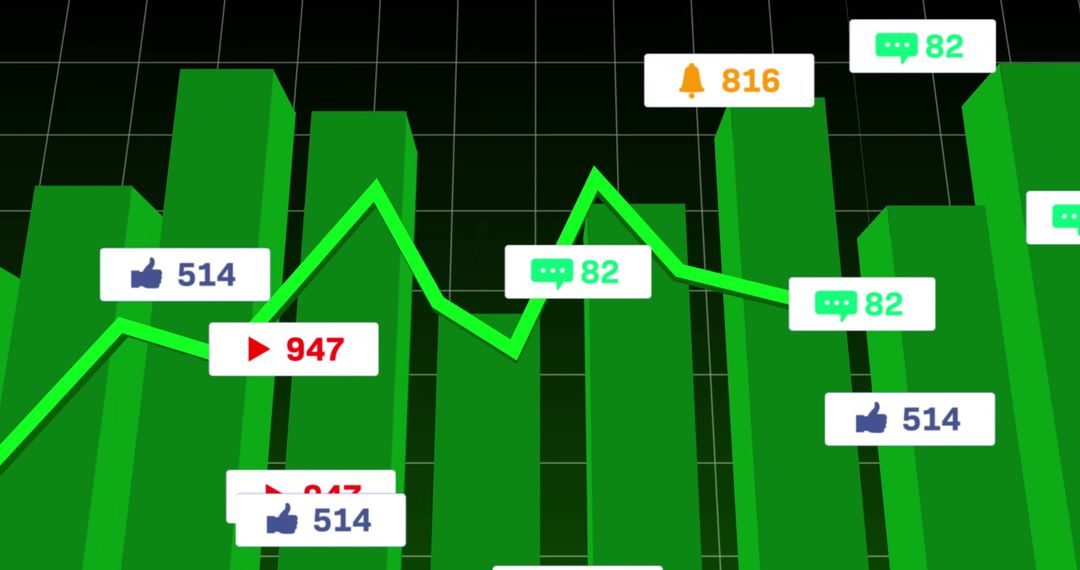
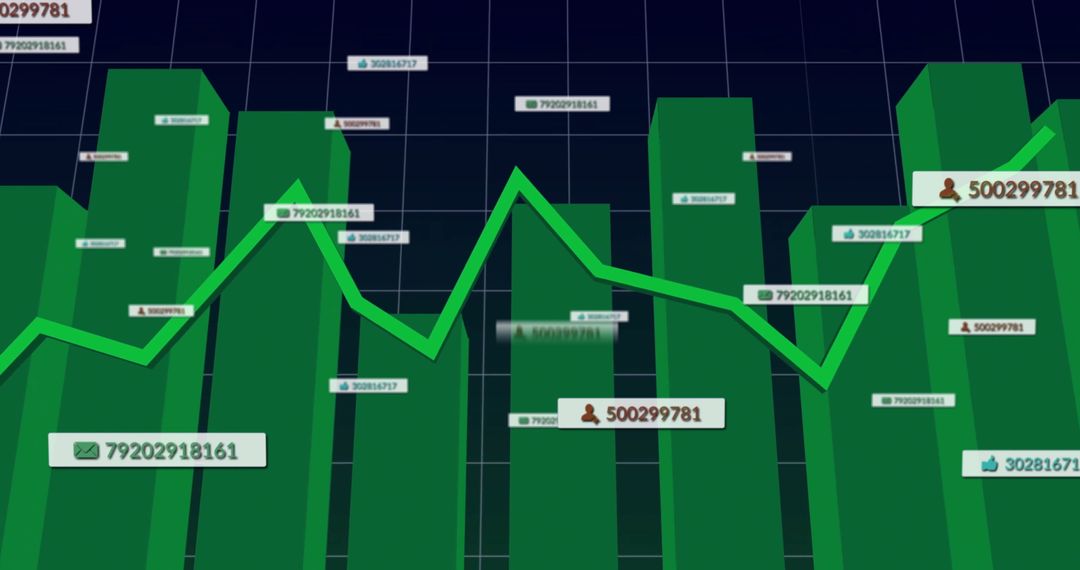
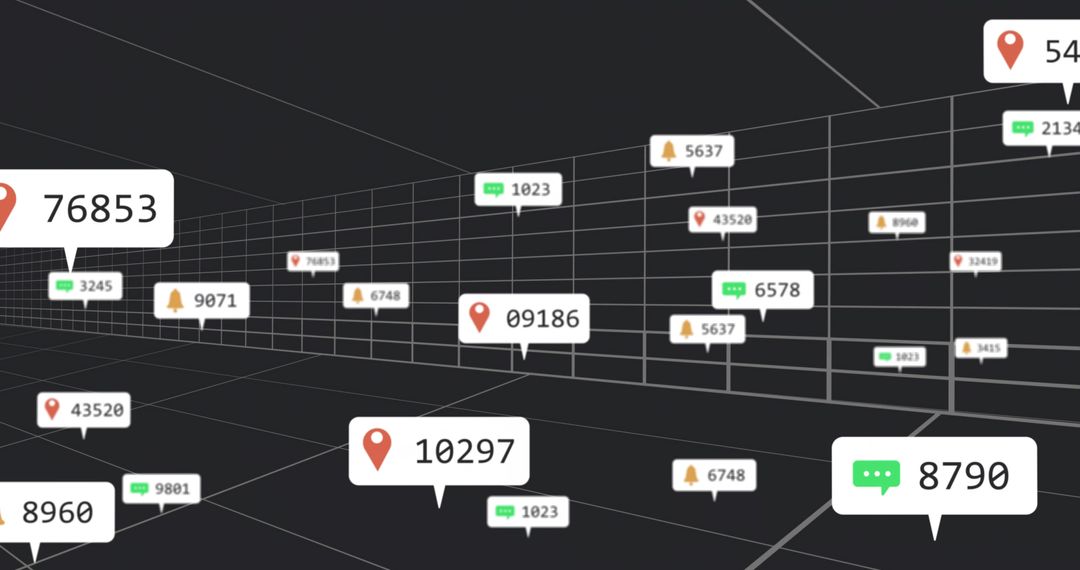
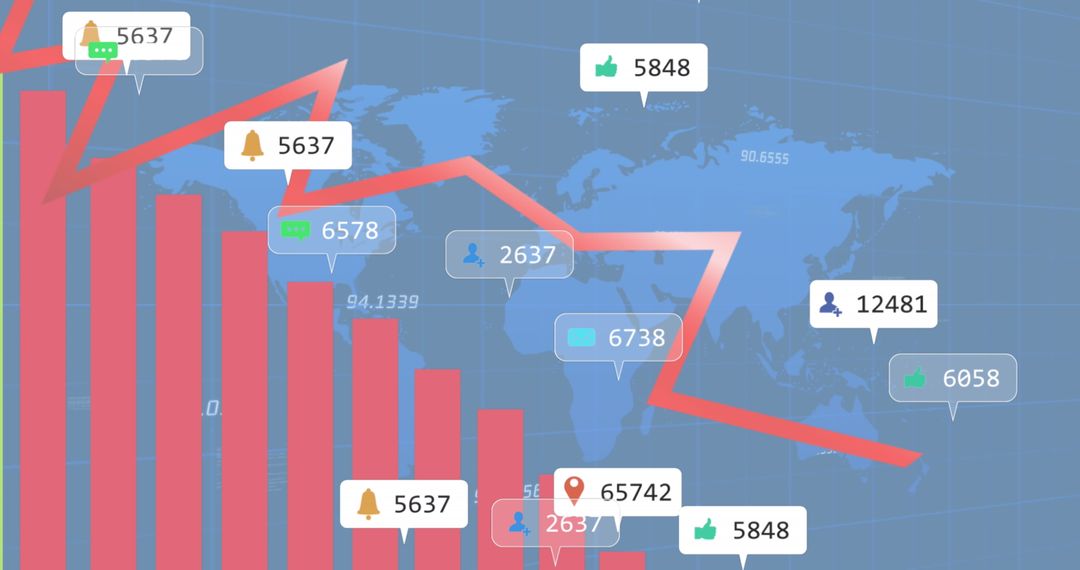
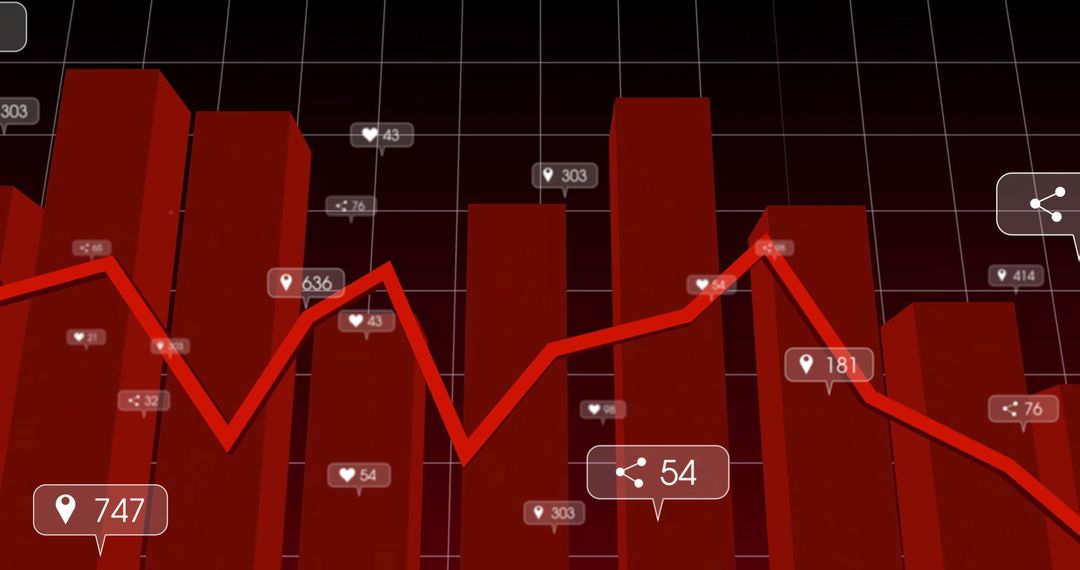
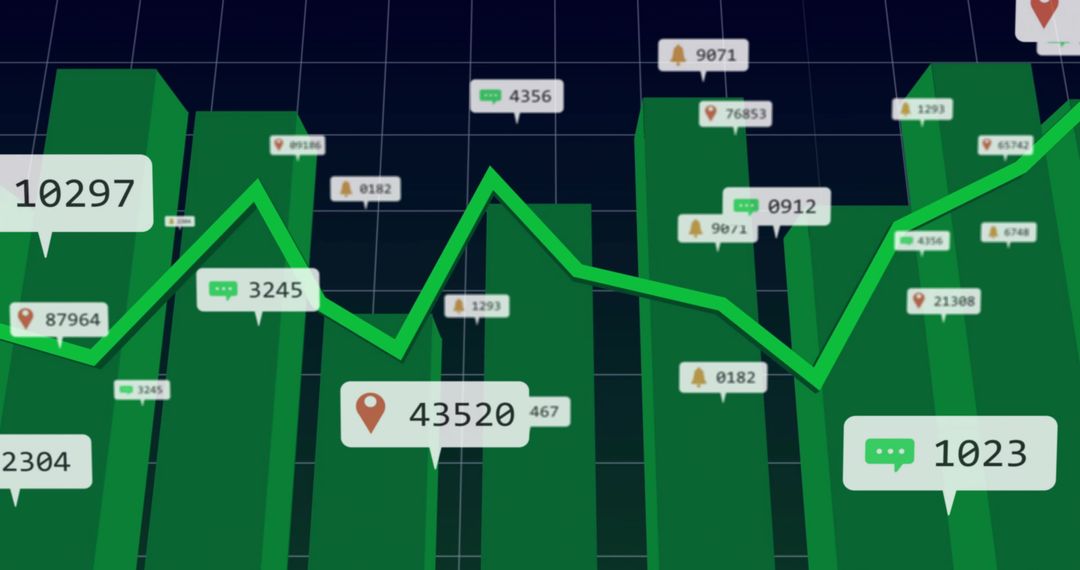
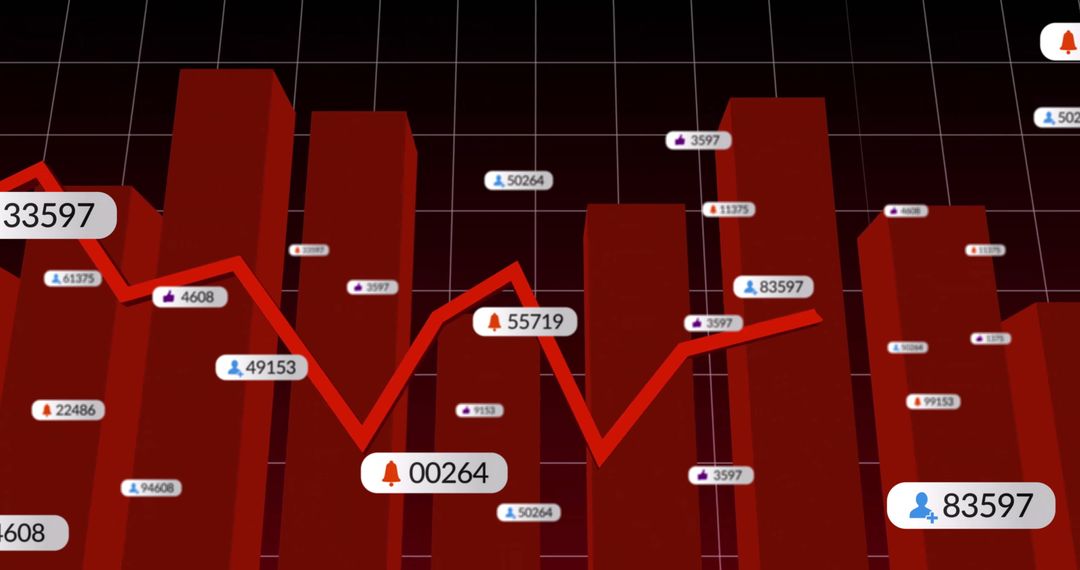
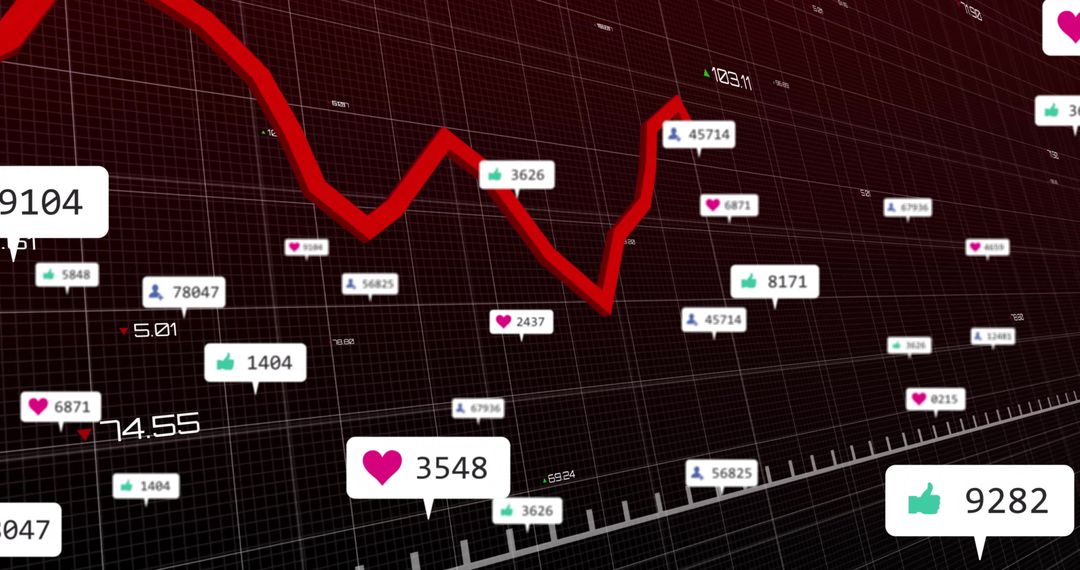
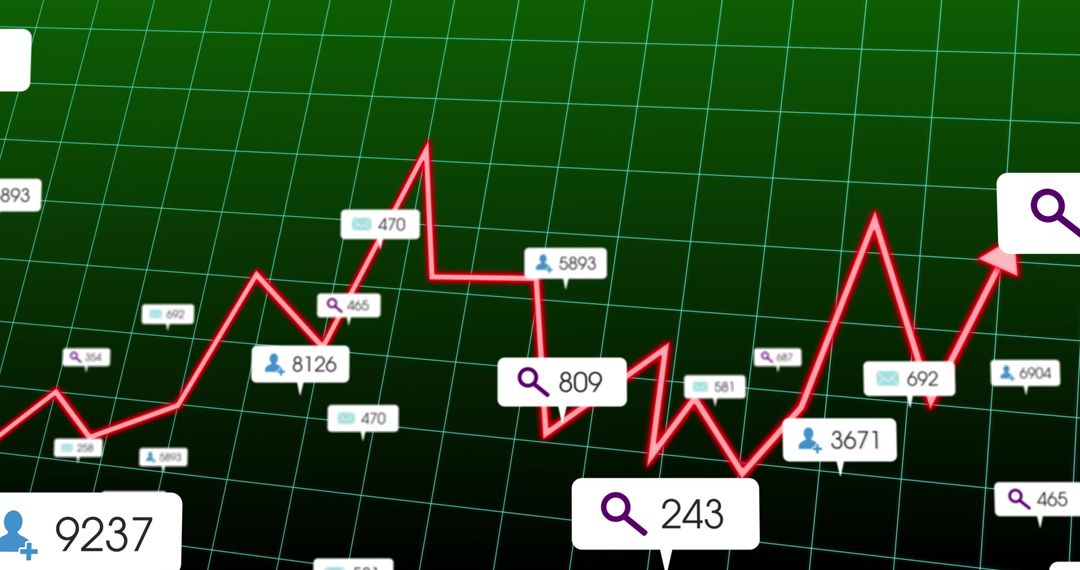
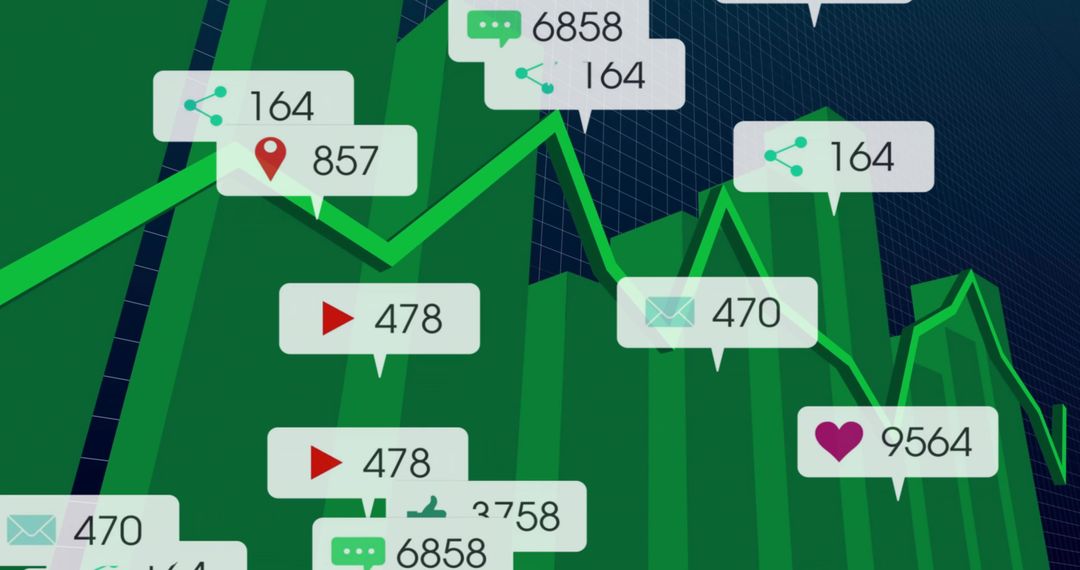
- 3D Bar Chart with Jagged Trend Line and Social Metric Callouts for Analytics Dashboard
3D Bar Chart with Jagged Trend Line and Social Metric Callouts for Analytics Dashboard Image
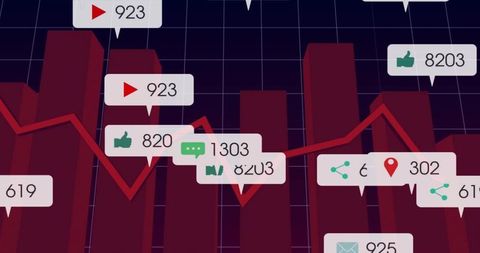
Showing red 3D bars rising from dark purple grid, jagged red trend line tracking data fluctuations, and white callouts with icons for likes, views, comments, shares and location. Providing modern high-contrast infographic look suitable for business analytics, social media performance reports, marketing presentations and dashboard headers. Working well as hero banner for analytics blog, slide deck background for quarterly reports, social media post visual, or cover for marketing collateral. Allowing easy overlay of branding, custom metrics and animated transitions for video and motion graphics. Offering clear focal points for highlighting spikes, drops and engagement metrics in data storytelling.
Powered by  - Get 15% off with code: PIKWIZARD15


0
downloads
downloads
Tags:
More
Credit Photo
If you would like to credit the Photo, here are some ways you can do so
Text Link
photo Link
<span class="text-link">
<span>
<a target="_blank" href=https://pikwizard.com/photo/3d-bar-chart-with-jagged-trend-line-and-social-metric-callouts-for-analytics-dashboard/aa030c73cb793e9245a0445cf9b34c75/>PikWizard</a>
</span>
</span>
<span class="image-link">
<span
style="margin: 0 0 20px 0; display: inline-block; vertical-align: middle; width: 100%;"
>
<a
target="_blank"
href="https://pikwizard.com/photo/3d-bar-chart-with-jagged-trend-line-and-social-metric-callouts-for-analytics-dashboard/aa030c73cb793e9245a0445cf9b34c75/"
style="text-decoration: none; font-size: 10px; margin: 0;"
>
<img src="https://pikwizard.com/pw/medium/aa030c73cb793e9245a0445cf9b34c75.jpg" style="margin: 0; width: 100%;" alt="" />
<p style="font-size: 12px; margin: 0;">PikWizard</p>
</a>
</span>
</span>
Free (free of charge)
Free for personal and commercial use.
Author: Awesome Content
Similar Free Stock Images

Premium


Premium


Premium


Premium


Premium


Premium


Premium


Premium


Premium


Premium


Premium


Premium


Premium


Premium


Premium


Premium


Premium


Premium


Premium


Premium


Premium


Premium


Premium


Premium

