- Home >
- Stock Photos >
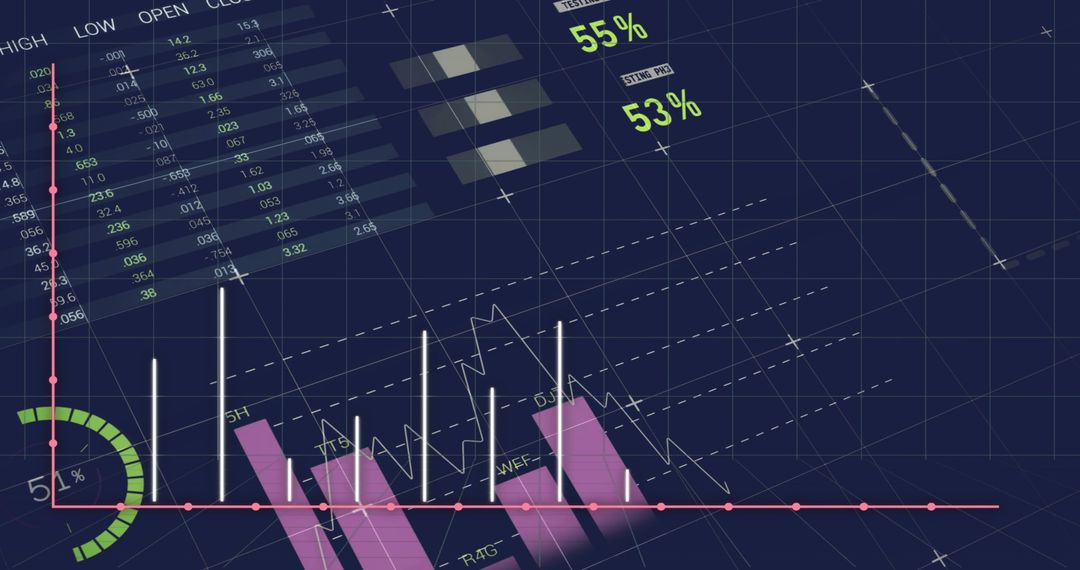
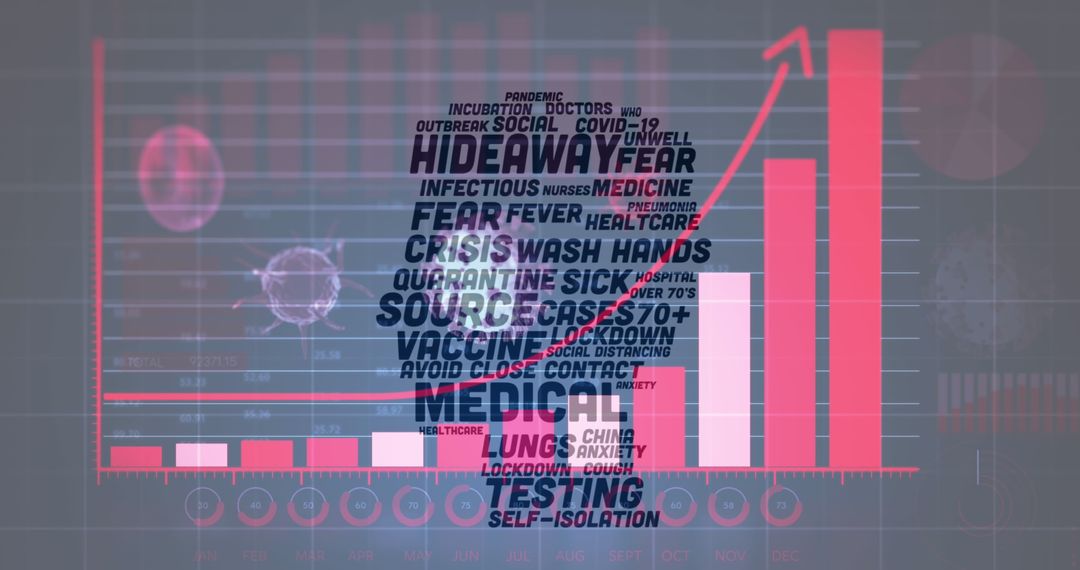
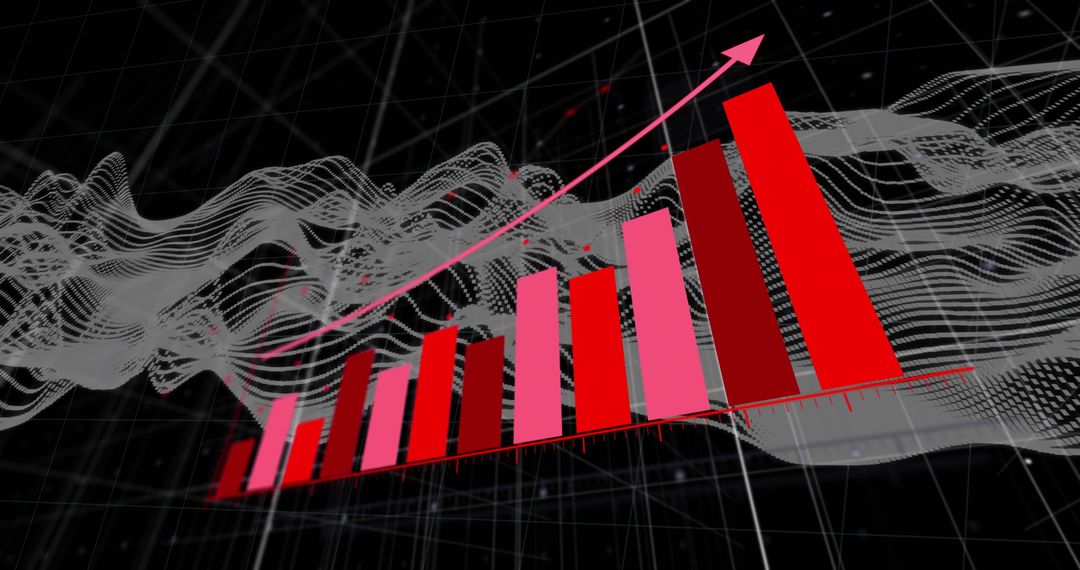
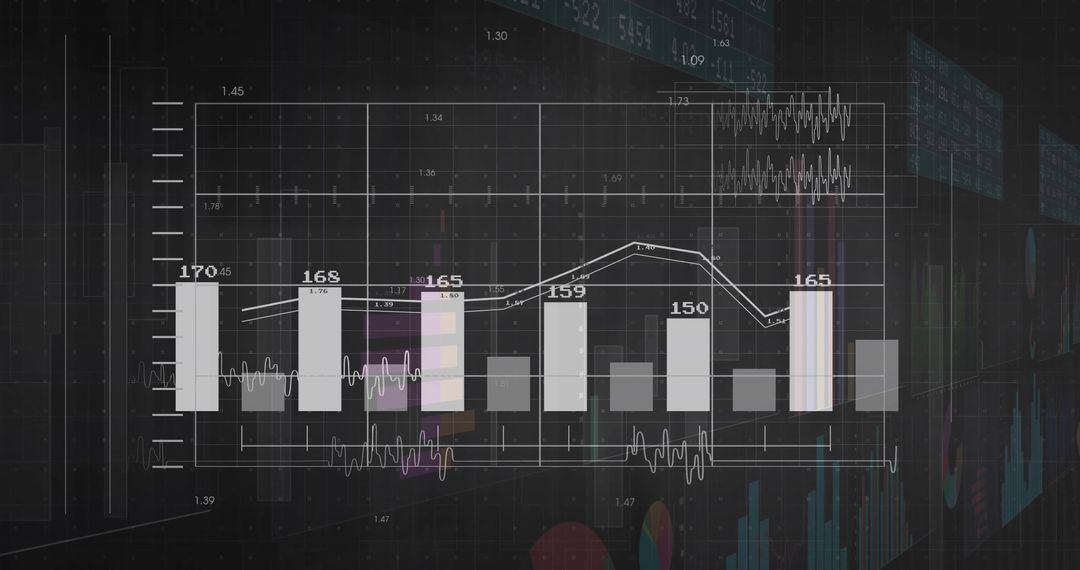
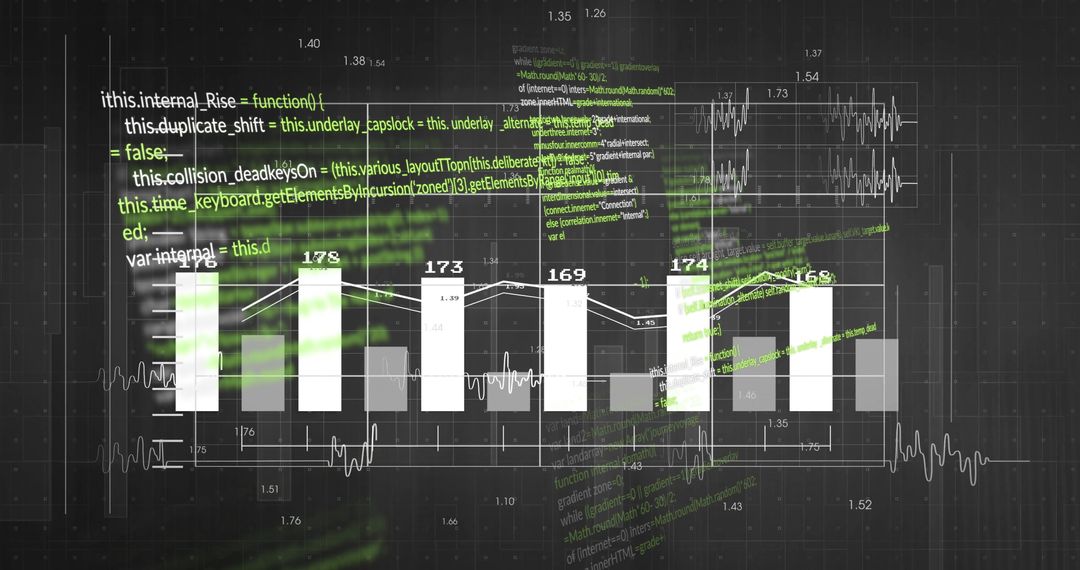
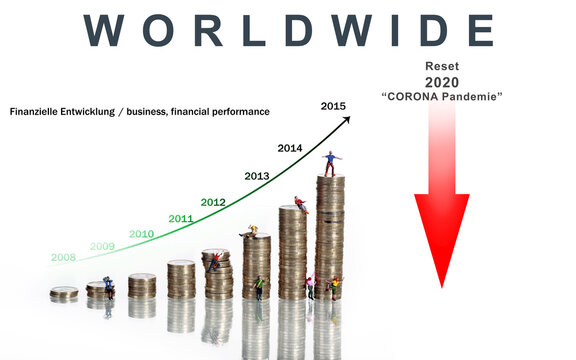
- 3D Bar Chart with Virus Icons and Line Graph in High Tech Interface
3D Bar Chart with Virus Icons and Line Graph in High Tech Interface Image

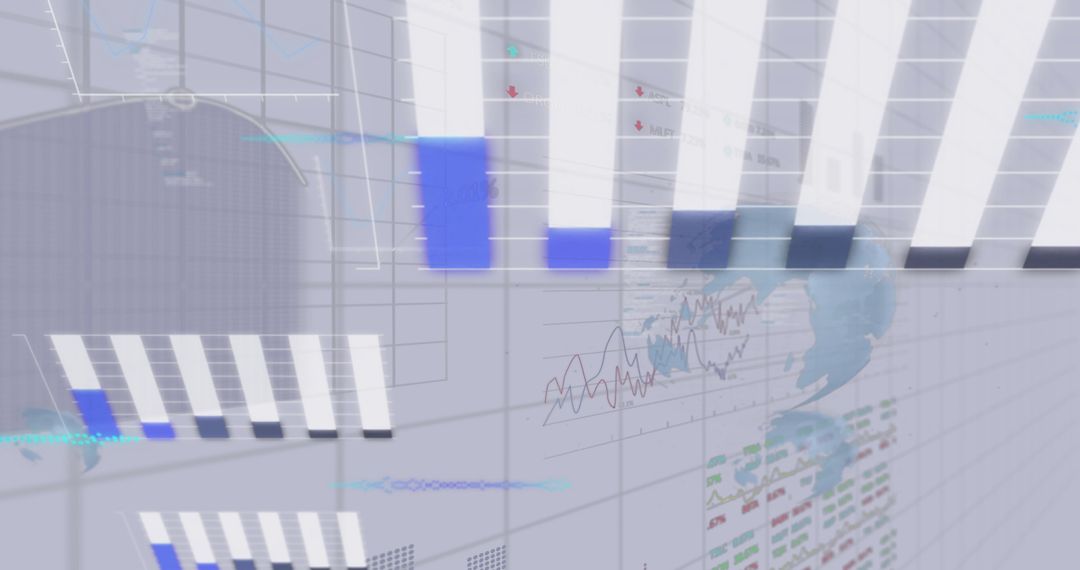
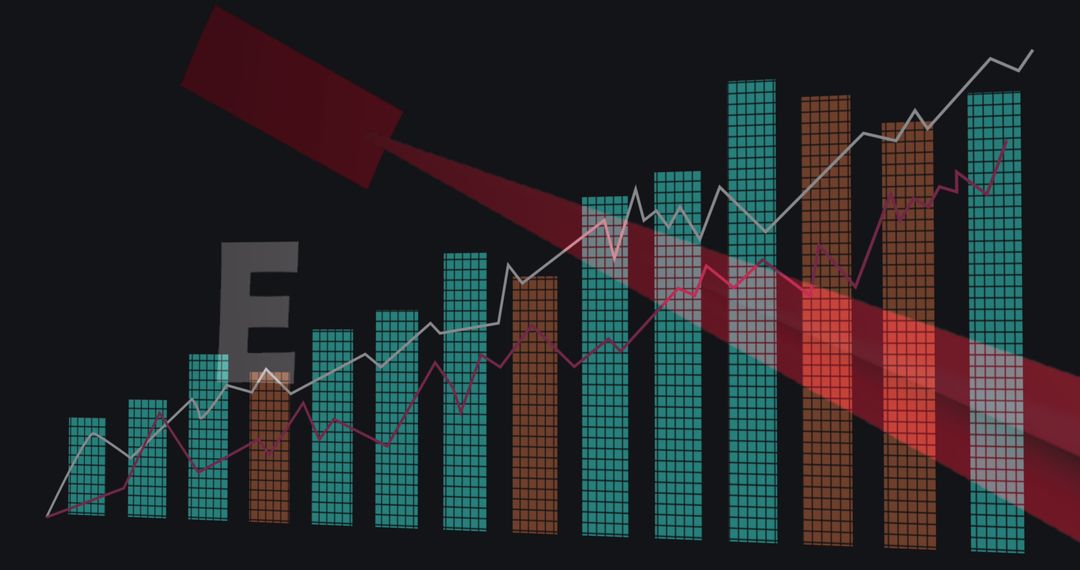
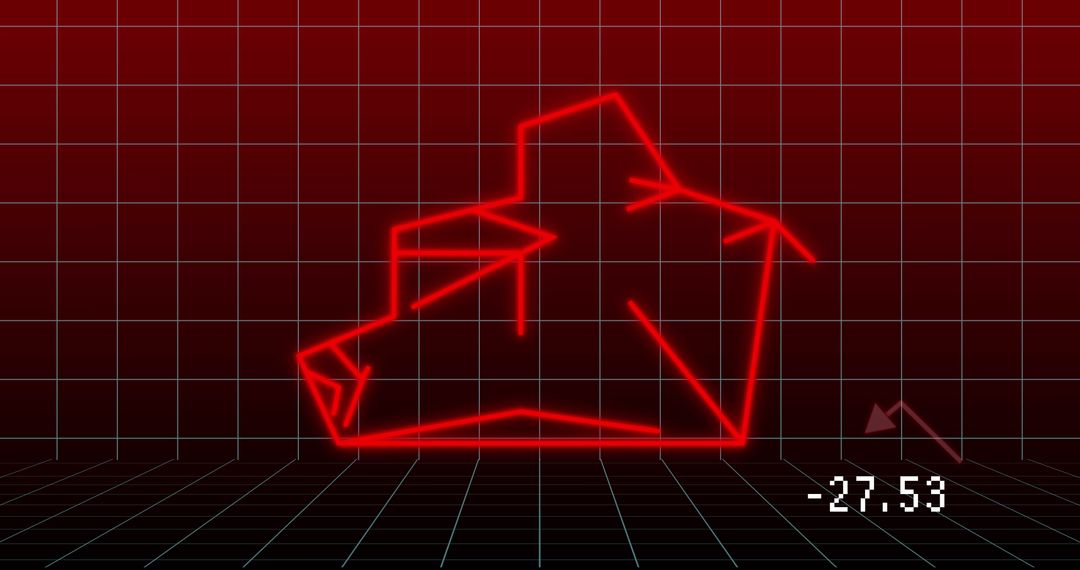
This visual illustrates trending data using a 3D bar chart, accompanied by virus icons and a fluctuating line graph, depicted within a futuristic dashboard setting. It captures elements of technology coalescing with public health data, offering visuals pertinent to sectors such as health technology analysis, financial forecasting, and innovation frameworks during medical research developments. This high tech representation is suited for projects necessitating advanced data presentation themes, health monitoring systems, and impact visualization on current pandemic statistics.
Powered by 


0
downloads
downloads
Tags:
More
Credit Photo
If you would like to credit the Photo, here are some ways you can do so
Text Link
photo Link
<span class="text-link">
<span>
<a target="_blank" href=https://pikwizard.com/photo/3d-bar-chart-with-virus-icons-and-line-graph-in-high-tech-interface/8a7c3e6a8e59b1ba3b638bb0bcfa9fd7/>PikWizard</a>
</span>
</span>
<span class="image-link">
<span
style="margin: 0 0 20px 0; display: inline-block; vertical-align: middle; width: 100%;"
>
<a
target="_blank"
href="https://pikwizard.com/photo/3d-bar-chart-with-virus-icons-and-line-graph-in-high-tech-interface/8a7c3e6a8e59b1ba3b638bb0bcfa9fd7/"
style="text-decoration: none; font-size: 10px; margin: 0;"
>
<img src="https://pikwizard.com/pw/medium/8a7c3e6a8e59b1ba3b638bb0bcfa9fd7.jpg" style="margin: 0; width: 100%;" alt="" />
<p style="font-size: 12px; margin: 0;">PikWizard</p>
</a>
</span>
</span>
Free (free of charge)
Free for personal and commercial use.
Author: Authentic Images
Similar Free Stock Images