1. Home > 
  2. Stock Photos > 
  3. 3D Bar Graph and Data Streams in Digital Network Interface

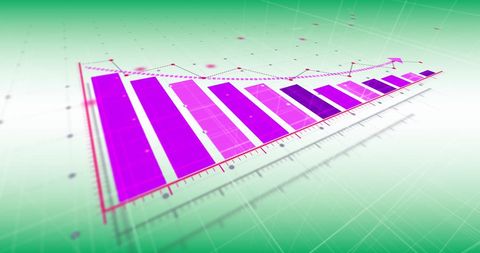
3D Bar Graph and Data Streams in Digital Network Interface Image

3D Bar Graph and Data Streams in Digital Network Interface

Light blue 3D bar graph rising within a complex virtual grid network communicates advancements in data presentation and infographics technology. Floating numerical codes add to sophisticated digital business analytics style perfect for using in commercial, technological presentations or educational materials focusing on futuristic data analysis and business growth forecasting.

Powered by Adobe logo
Futuristic 3D pie chart made of glowing particle cloud. Concept of market data segmentation and financial allocation analysis. - Powered by AdobeModern 3D data visualization of a glowing red translucent bar chart on a dark blue background. Business analytics and financial growth concept. - Powered by Adobeabstract glass data bars, colorful transparent bar chart
 - Powered by Adobe3D gold bars forming an upward graph line representing market growth - Powered by AdobeFinancial market data analysis with glowing 3D bar and line charts on dark background showing economic trends and growth concept visualization. 3D Rendering - Powered by Adobe

Credit Photo

If you would like to credit the Photo, here are some ways you can do so

Free (free of charge)

Free for personal and commercial use.

Author: Authentic Images

Similar Free Stock Images

Covid-19 Data Visualization with Growth Chart and Virus Cells
Premium
Colorful digital data visualization with glowing vertical bars and lines in warm and cool tones representing abstract technology and data analysis
Futuristic Financial Data and Binary Code Visualization
Data Analysis Overlay with Ukrainian Nuclear Theme
Abstract Financial Data Chart with Gradient Background
Digital Financial Data Infographic on Blue Background
Premium
Minimalist 3D bar chart on transparent background for business data visualization and financial growth.
Data Analysis and Security in Digital Business Environment
Futuristic Financial Growth Chart Over Urban Nightscape
Vibrant Finance Data Analysis with Growing Chart on Digital Background
Rising Financial Graph and US Dollar Collage
Premium
Rising bar graph isolated on white background
Futuristic Infographic Display with Glowing Pink Bar Graph
Financial Data Processing with Bar Charts and Line Graphs
Rising Arrow Over Global Bar Graph in Data-Driven Digital World
Digital Data Processing with Abstract People Icons
Premium
3D Data Visualization Concept with Colorful Bar Graphs on Dark Background to Represent Growth, Progress, and Success in Business Metrics
Data Processing and Analysis Over City Skyline
Composite Digital Growth Chart Over Server Infrastructure
Financial Data Chart in High-Tech Server Room Environment
Animated Bar Graphs and Globe Highlighting Financial Loss and Globalization
Premium
Big data technology data science analysis artificial intelligence generative ai deep learning machine learning algorithm neural flow network analytics innovation abstract futuristic. 3d rendering.
Futuristic Stock Market Growth Bar Graph Cityscape Background
Bar Chart Data Over Internal Cloud Environment
Futuristic Digital Graph Representing Growth and Analytics
Digital Bar Graph with Declining Data Points on Green Background
Premium
Three ascending blue 3D bars illustrate growth, progress, and data visualization. A minimalist representation of statistical trends and increasing metrics on a reflective surface.
Abstract Digital Data and Bar Chart Visualization
Data Visualization Overlay on Dark Stormy Background
Rising Bar Chart With Equations Illustrating Financial Growth
3D Graph Showing Financial Growth with Rising Bar Chart
Global Finances Downtrend with Digital Business Keywords Overlay
Abstract Financial Data Analysis with Graphs and Arrow
Premium
Big data technology data science analysis artificial intelligence generative ai deep learning machine learning algorithm neural flow network analytics innovation abstract futuristic. 3d rendering.
Abstract Digital Financial Graph With Futuristic Grid
Visualizing Financial Data with Abstract Blue Bar Graph
Digitally Generated Financial Growth Chart on Abstract Background
Digital Financial Downtrend with Cityscape and Red Arrow
Premium
Futuristic global investment ecosystem showing holographic Earth surrounded by digital stock charts and currency symbols.
Rising Graph over Cityscape Symbolizing Global Business Growth
Man Analyzing Data on Laptop with Upward Business Graph Overlay
Digital Interface with Descending Red Arrow and Data Diagrams
Financial Data and Graph Overlay on Ukraine Flag
Premium
Stunning 3D Visualization of Rising Bar Graphs Representing Business Growth and Financial Success on Abstract Digital Background
Team Analyzing Downward Business Trends with Graph Overlay
Abstract Financial Growth Chart with Economic Data Graphics
Social Media Engagement Icons Overlaying Data Graph
Office Bar Graph Indicating Economic Downturn Over Meeting Room
Premium
Holographic business dashboard displaying pie chart and bar graph with futuristic blue and orange data visualization
Descending Arrow Icons with Colored Bar Graphs on Black Background
Innovative Data Visualization Overlaying Digital Head Model
Infographic Bar Graph with Rising Arrow on Rotating Globe
Rising Bar Graph Against Dramatic Stormy Sky
Premium
abstract glass data bars, colorful transparent bar chart
Futuristic Data Visualization with Bar Chart Over Digital Grid
Abstract Futuristic Bar Graph with Pink Bars and Grid Background
Abstract Financial Data and Analysis Dashboard with Rising Graphs
Abstract 3D Graph on Digital Grid with Dramatic Background
Premium
Glowing golden financial charts show upward market growth with digital wealth assets
Digital Chart Display Showing Rising and Falling Trends
Futuristic 3D Interface with Data Visualization Charts
Futuristic 3D Financial Dashboard Displaying Gradient Bar Chart with Trajectory Arrow
Digital Financial Analytics with Growing Bar Chart
Global Finance Analytics with Rising and Falling Charts
Financial Graph Data Overlay Ukraine Flag Concept
Premium
3D business plan graph illustration with modern technology elements
Data Overlays on Virus Imagery Illustrating Medical Analysis
Rising Bar Graph with Red Arrows on Digital Background
Red Arrow with Financial Decline in Urban Setting Overlay
Futuristic Graph Overlay with Cityscape and Digital Interface
Premium
Vibrant 3D bar graph displayed on smartphone screen, showcasing colorful data visualization against blurred background of fluctuating graphs. This represents modern technology and analytics
Digital Statistics Analysis with Declining Red Arrow
Downward Financial Trend with Data Visualization Elements
Financial Crisis Concept with Graph and Ukraine Flag Background
Futuristic Digital Economy Growth Chart and Global Map
Premium
A vibrant, 3D visualization of data with bar graphs and line charts, showcasing trends and statistics in a modern design.
Business Data Analytics Displayed Over Smartphone on Office Desk
Digital Financial Data with Illuminated Graph on Blue Interface
Rising Business Graph and Data Analytics in Modern Office
Digital Data Visualization Over Modern Cityscape
Premium
3D charts and graphs illustrate financial data
Global Data Visualization with Declining Graphs and World Map Hologram
Rising Profits Illustrated by Bar Graph and Global Hologram
Analyzing Global Financial Growth Through Digital Technology
Digital Data Visualization Over Stormy Background
Premium
Abstract 3D render of location pin on map with glowing lines, bar chart. Digital data visualization for business strategy, data analytics research. Navigation insight, connectivity concept for modern
Growing Bar Graph in Abstract Digital Space
Rising Financial Graph with Digital Data Overlay
Rising Bar Graph on Dynamic Orange Background
Dynamic Bar Graph with Downward Trend on Red Grid Background
Premium
Abstract three-dimensional bar graph visualization with varying heights representing data peaks and trends in a futuristic digital environment with soft lighting
Futuristic Data Analysis with Bars and Neon Technology
Colorful 3D Bar Chart Visualizing Financial Data with Neon Candlestick Grid Overlay
Financial Growth Chart Overlaying Data Center
Financial Market Trends on Russian Flag Background
Ukraine Financial Graph with Declining Trends
Digital Graph Data Analysis on Abstract Pink Background
Premium
White seamless house tokens with cyan holographic price graph and crisp shadows
Dynamic Financial Growth Chart Visual on Green Background
Dynamic Data Processing Concept with Growth Chart
Dynamic Financial Graph Overlay on Smart Cityscape
Dynamic Financial Data Visualization on Digital Grid
Premium
Displaying clustered network graph pulsing on dark dashboard, with pink nodes thin edges teal wave
Economic Data Analysis Overlaid on Nepali Flag
Abstract Financial Data Chart with Blue Background
Digital Data Graph with Futuristic Interface Elements
Global Data Analysis Over World Map with Digital Interface
Premium
Digital 3D Graph Displaying Upward Performance Trend in Modern Data-Driven Environment
Digital Bar Graph Displaying Financial Growth in Office Setting
Digital Graph Projection in Modern Office Space
Rising Statistical Data in Stormy Digital Environment
Abstract Graph Rising Over Clouds Showing Growth and Progress
Premium
3D glowing blue bar graph with upward arrow and data visualization on a dark futuristic background
Global Economic Data Trends with Rotating Earth and Graphs
Global Finance and Data Visualization with Map and Bar Graphs
Rising Chart Overlay on Stormy Skies Symbolizing Turbulent Growth
Network Bar Chart icon representing Data Pathways and Analytics
Premium
Vibrant 3D bar chart with metallic skyscrapers, reflecting green-blue gradient light
Abstract Financial Data Analysis with Bar and Line Graphs
Dynamic Abstract Bar Graph with Plot Line on Green Background
Digital Data Processing with Statistical Charts
Rising 3D Bar Graph Over Futuristic Data Grid for Analytics
Premium
Digital business growth concept with glowing bar chart on a computer chip, symbolizing data analysis, AI, and technological progress.
Visualizing financial growth with upward arrow, multi-line charts and 3D bar dashboard