
- Home >
- Stock Photos >
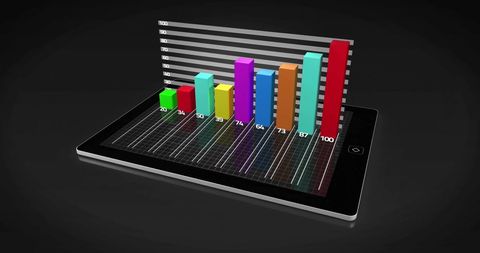
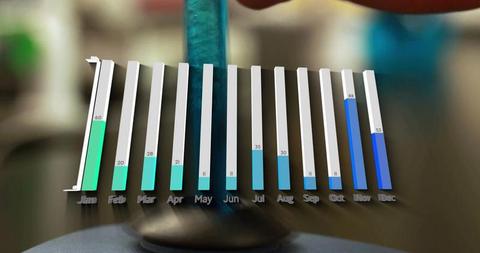
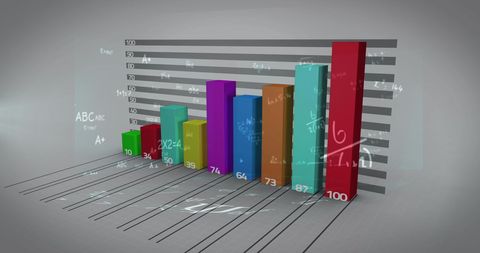
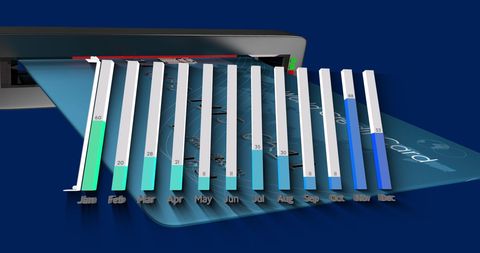
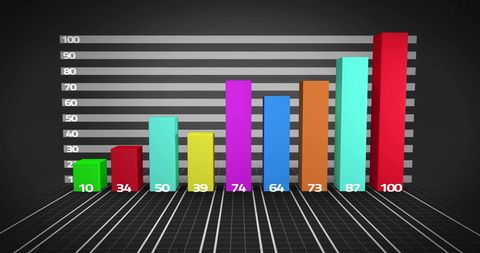
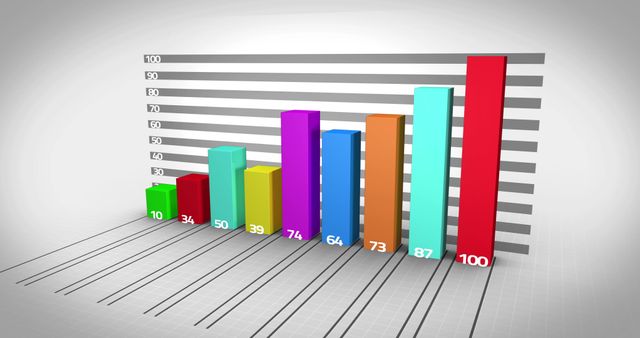
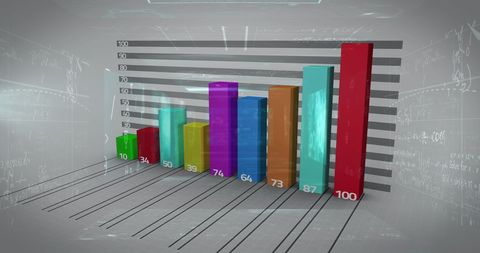
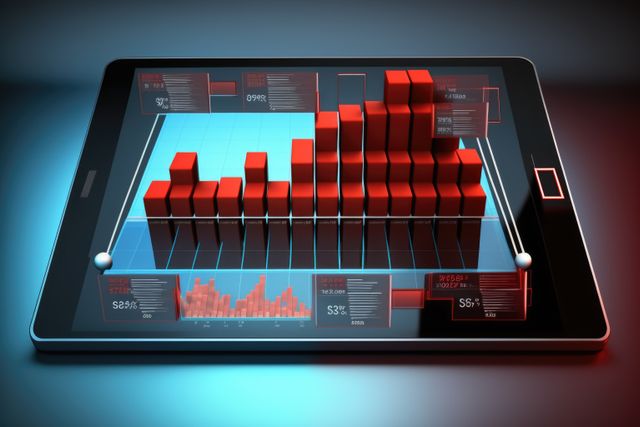
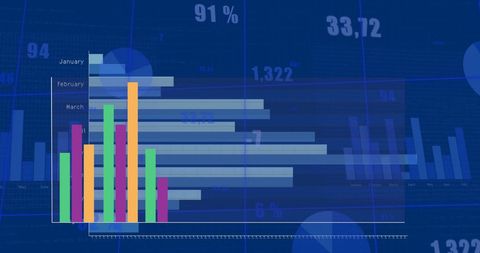
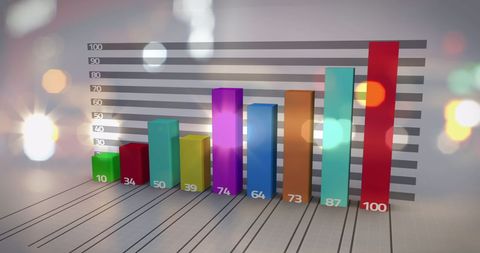
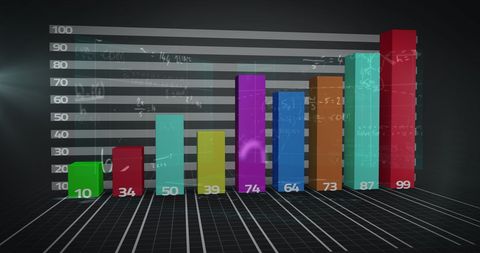
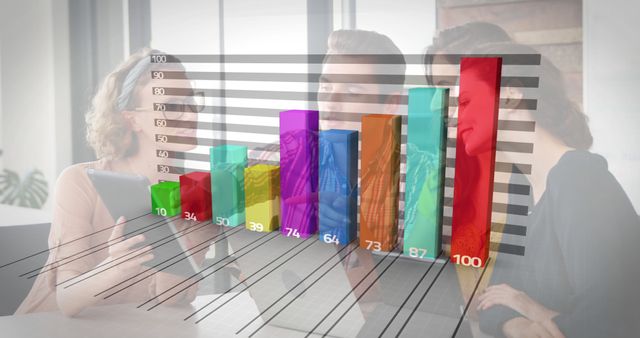
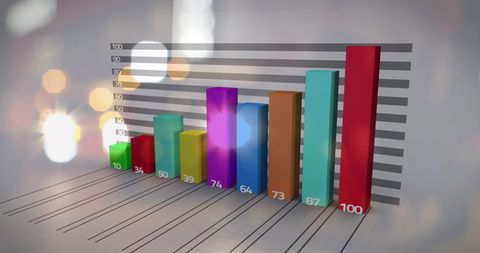
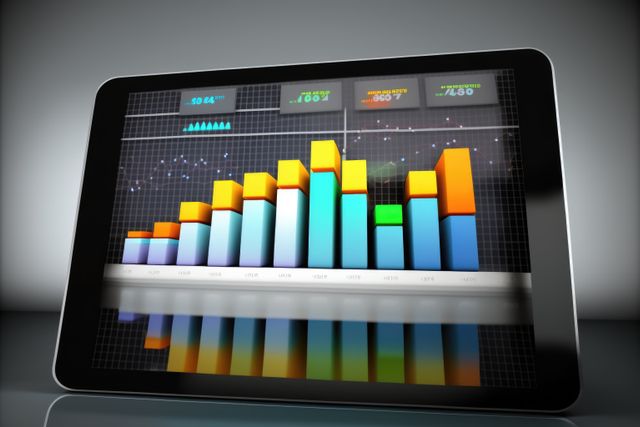
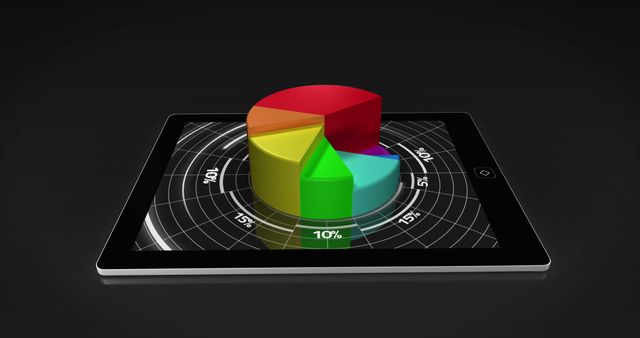
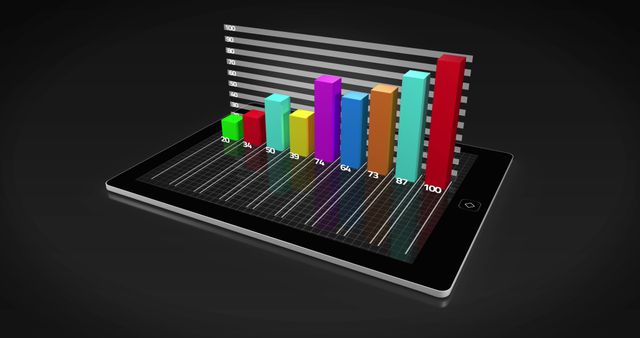
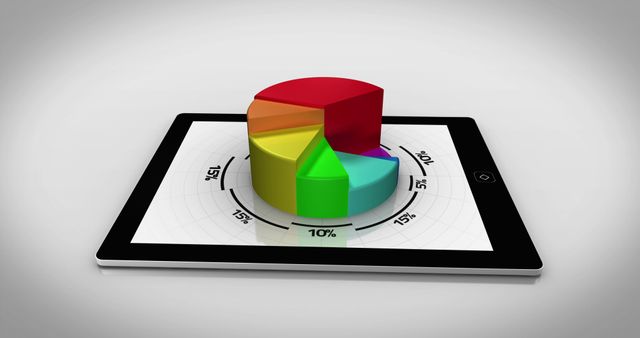
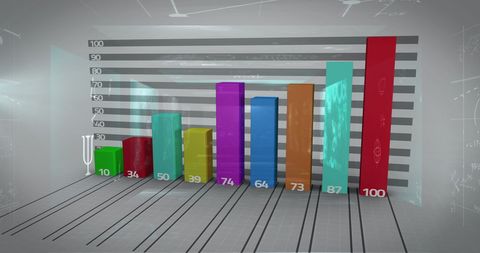
- 3D Bar Graph Display on Digital Tablet Screen
3D Bar Graph Display on Digital Tablet Screen Image
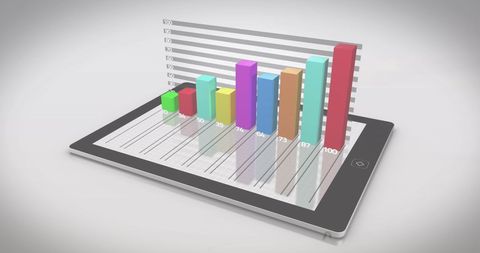
Representing modern data visualization with a three-dimensional bar chart over a tablet computer screen. Bright colors contrast the neutral background, highlighting data analytics and business intelligence themes. Ideal for use in presentations relating to digital solutions, information technology roles, data-driven marketing, finance reports, and educational media about statistics.

downloads
Tags:
More
Credit Photo
If you would like to credit the Photo, here are some ways you can do so
Text Link
photo Link
<span class="text-link">
<span>
<a target="_blank" href=https://pikwizard.com/photo/3d-bar-graph-display-on-digital-tablet-screen/8853f68bf56da00668a1b737731f4ffb/>PikWizard</a>
</span>
</span>
<span class="image-link">
<span
style="margin: 0 0 20px 0; display: inline-block; vertical-align: middle; width: 100%;"
>
<a
target="_blank"
href="https://pikwizard.com/photo/3d-bar-graph-display-on-digital-tablet-screen/8853f68bf56da00668a1b737731f4ffb/"
style="text-decoration: none; font-size: 10px; margin: 0;"
>
<img src="https://pikwizard.com/pw/medium/8853f68bf56da00668a1b737731f4ffb.jpg" style="margin: 0; width: 100%;" alt="" />
<p style="font-size: 12px; margin: 0;">PikWizard</p>
</a>
</span>
</span>
Free (free of charge)
Free for personal and commercial use.
Author: Awesome Content
Similar Free Stock Images
AI


AI


AI


AI

AI


AI


AI


AI


AI
AI


AI


AI


AI


AI


AI


AI


AI


AI


AI


Explore More Free Stock Images