- Home >
- Stock Photos >
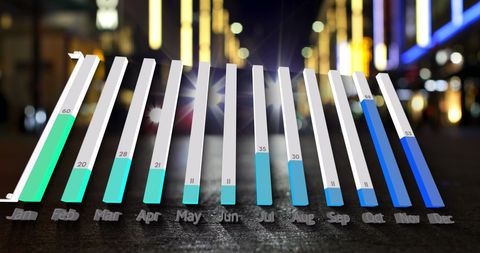
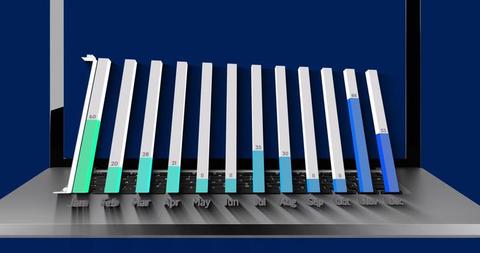
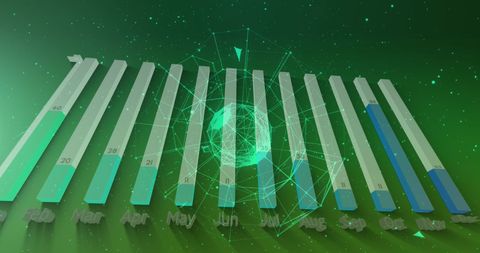
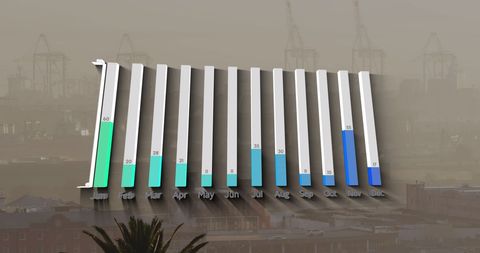
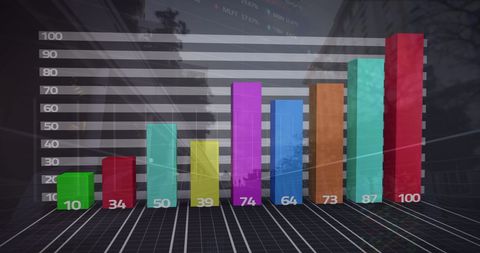
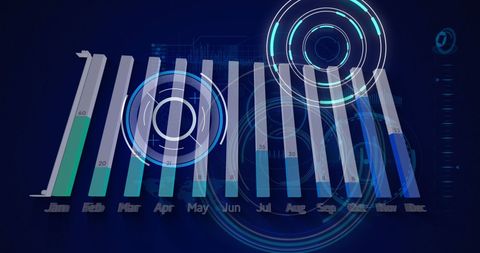
- 3D Bar Graph Displaying Data Across Months on Dark Background
3D Bar Graph Displaying Data Across Months on Dark Background Image

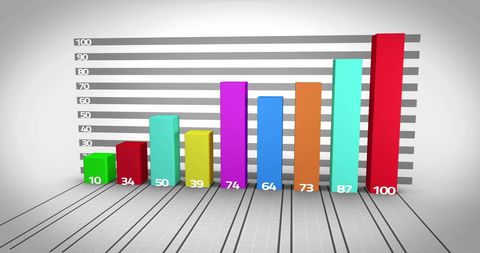
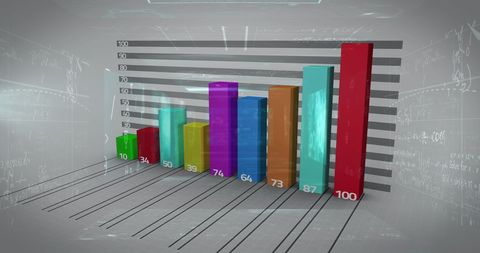
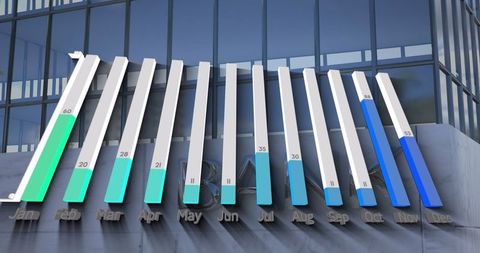
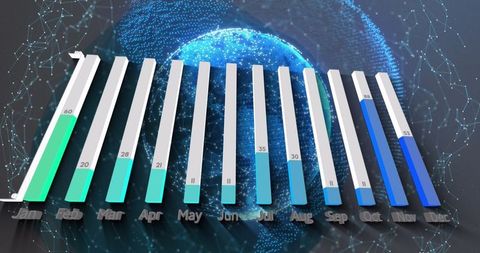
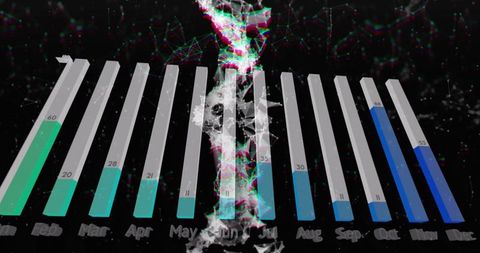
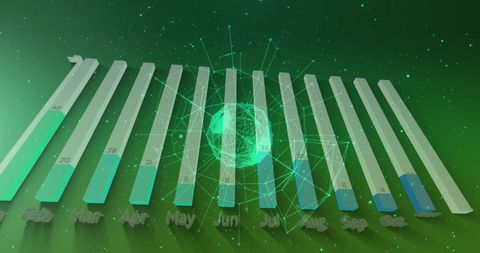
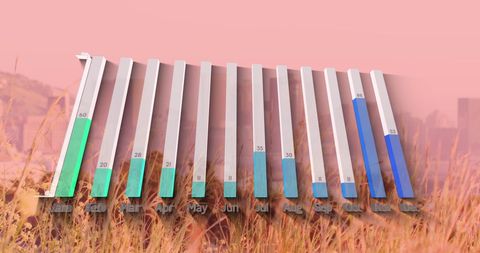
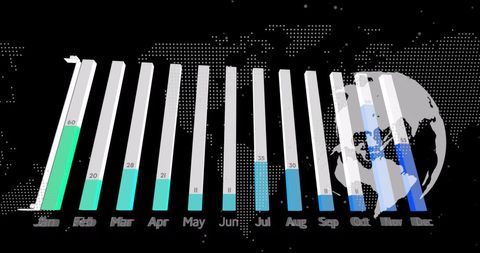
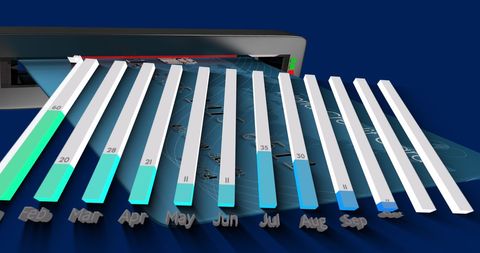
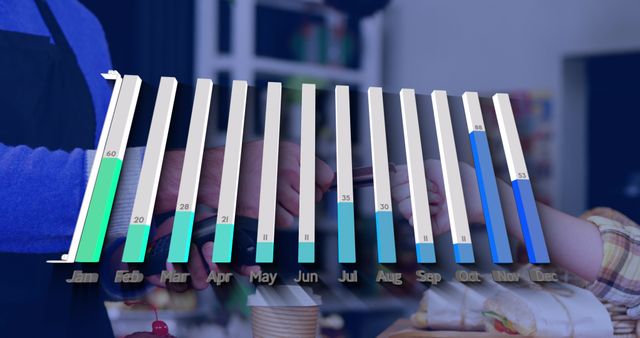
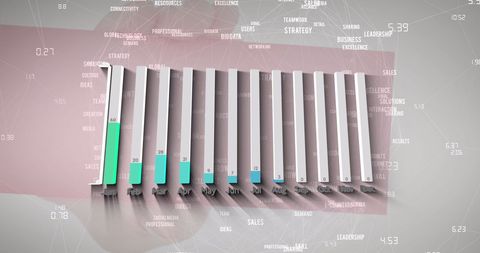
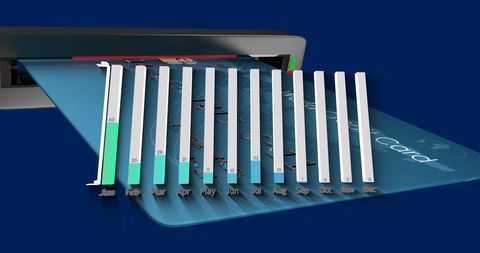
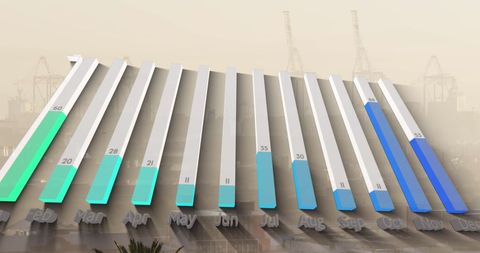
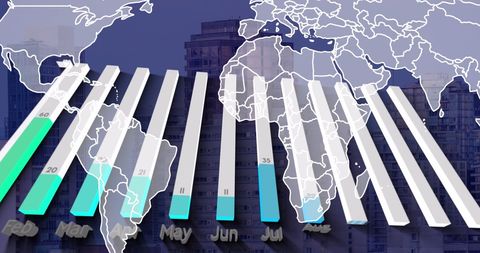
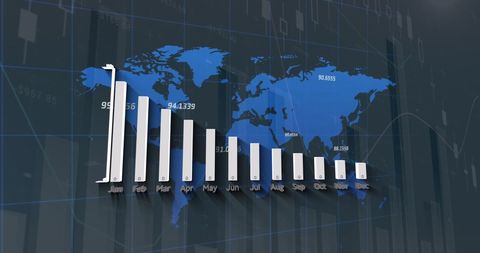
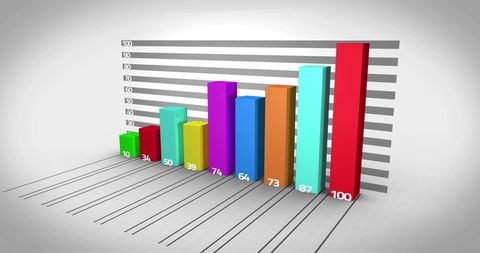
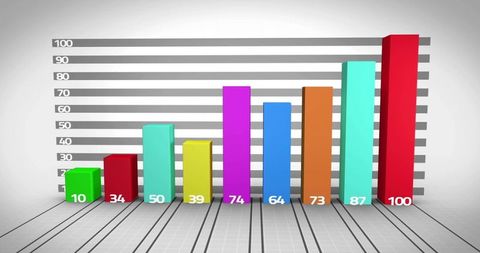
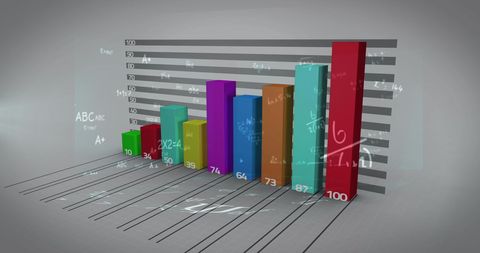
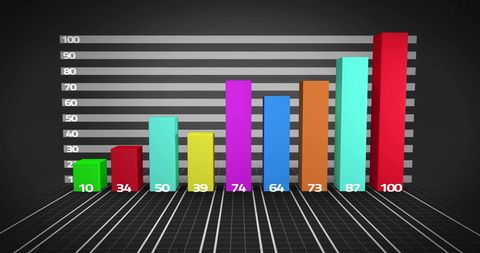
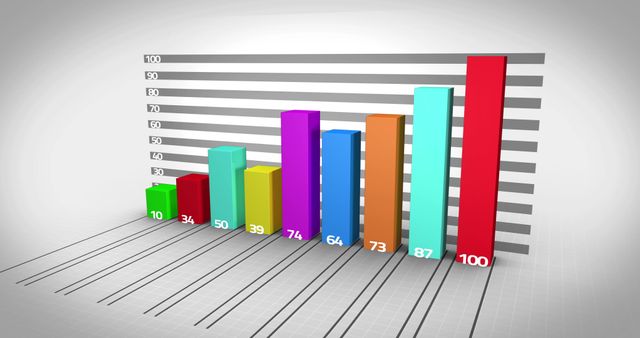
This digital 3D bar graph represents monthly data visualization laid out on a dark navy background. It illustrates statistical growth or analysis over the year, useful for presentations, business reports, and educational purposes focused on progress or trend analysis.

downloads
Tags:
More
Credit Photo
If you would like to credit the Photo, here are some ways you can do so
Text Link
photo Link
<span class="text-link">
<span>
<a target="_blank" href=https://pikwizard.com/photo/3d-bar-graph-displaying-data-across-months-on-dark-background/2a44c731d704ae018b03daa2ece93e40/>PikWizard</a>
</span>
</span>
<span class="image-link">
<span
style="margin: 0 0 20px 0; display: inline-block; vertical-align: middle; width: 100%;"
>
<a
target="_blank"
href="https://pikwizard.com/photo/3d-bar-graph-displaying-data-across-months-on-dark-background/2a44c731d704ae018b03daa2ece93e40/"
style="text-decoration: none; font-size: 10px; margin: 0;"
>
<img src="https://pikwizard.com/pw/medium/2a44c731d704ae018b03daa2ece93e40.jpg" style="margin: 0; width: 100%;" alt="" />
<p style="font-size: 12px; margin: 0;">PikWizard</p>
</a>
</span>
</span>
Free (free of charge)
Free for personal and commercial use.
Author: Authentic Images