- Home >
- Stock Photos >
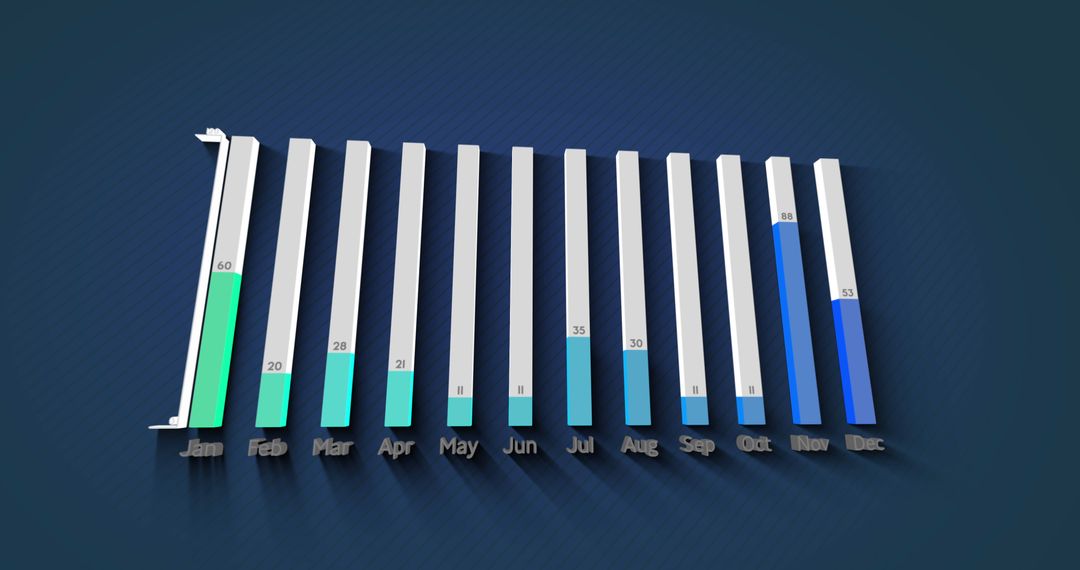
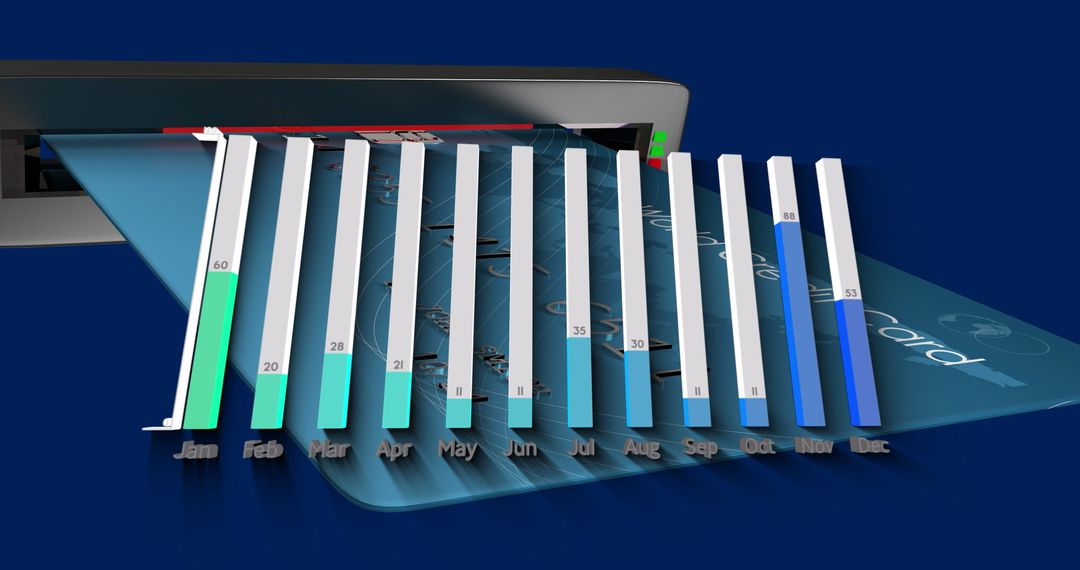
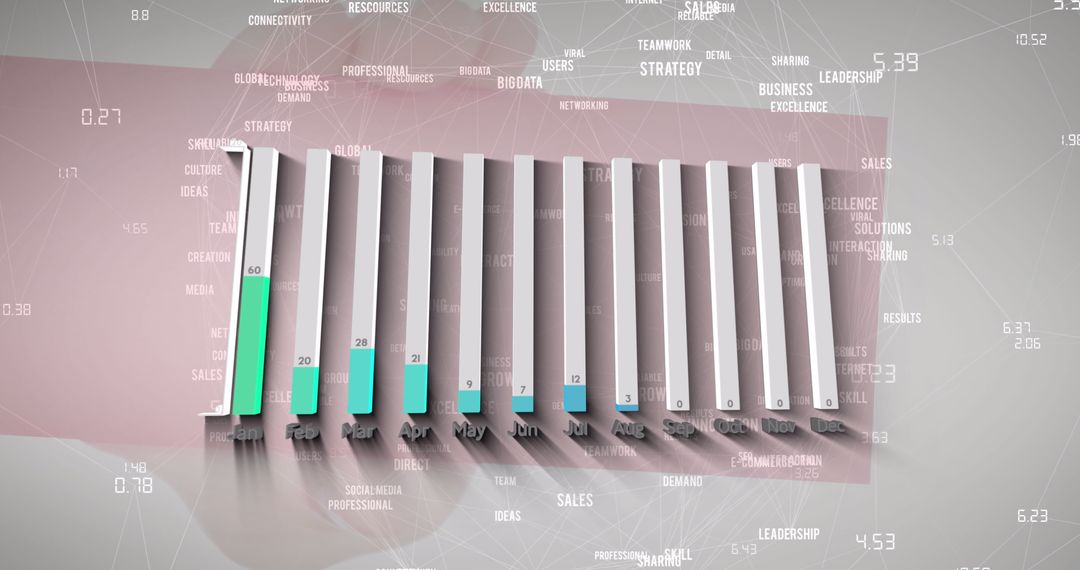
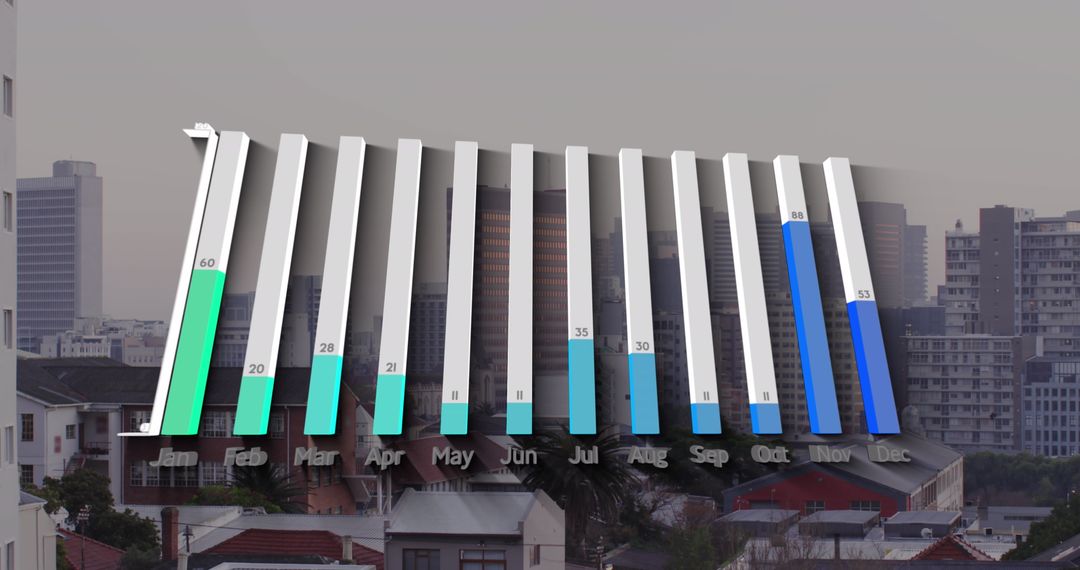
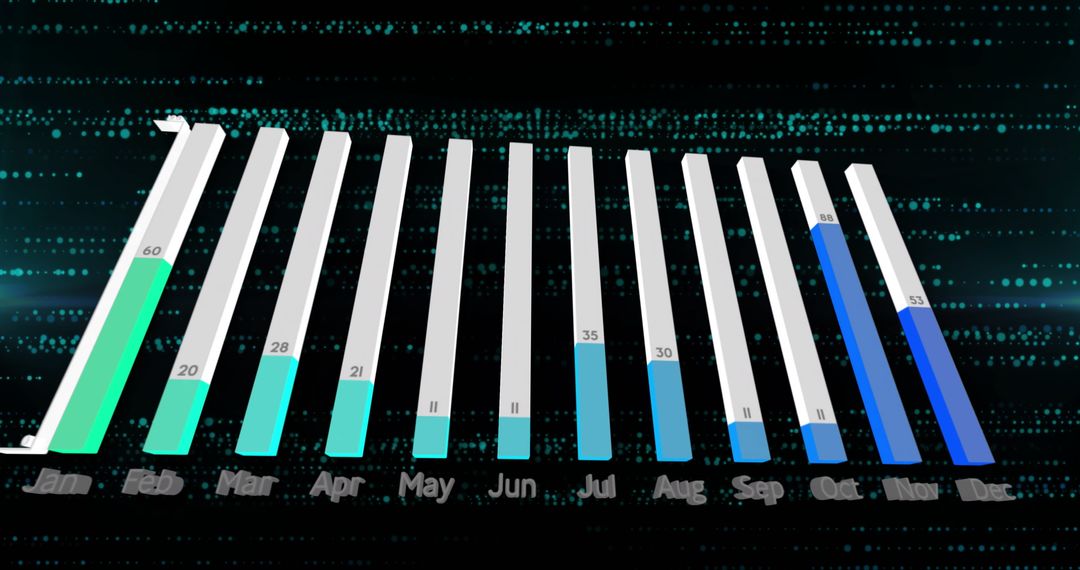
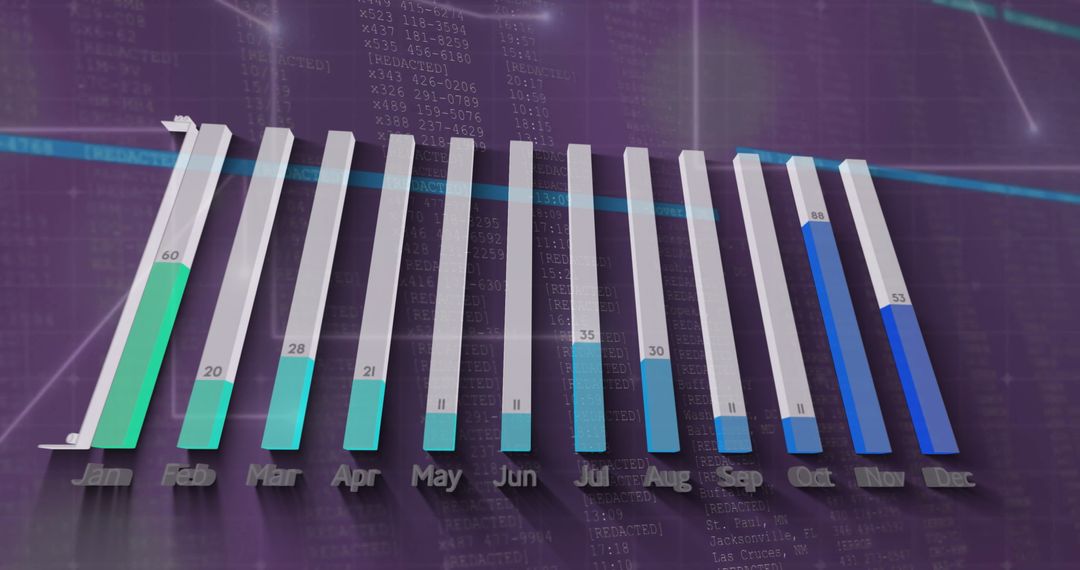
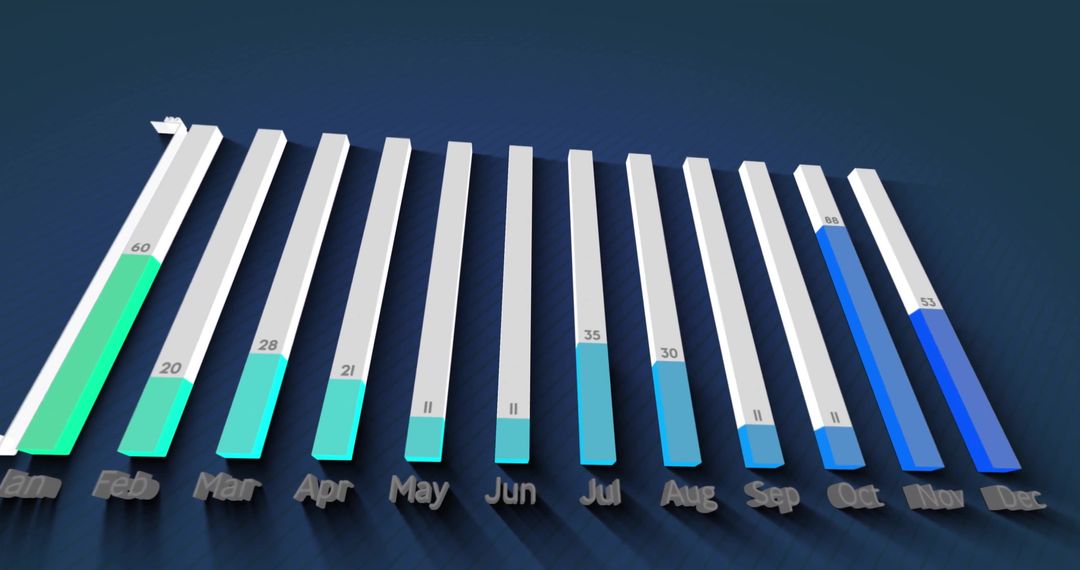
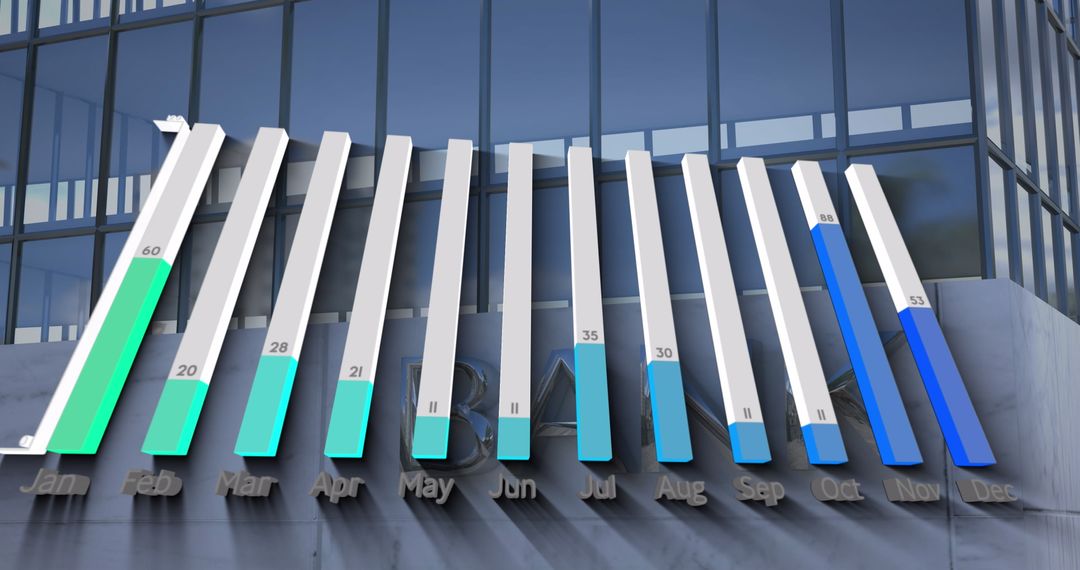
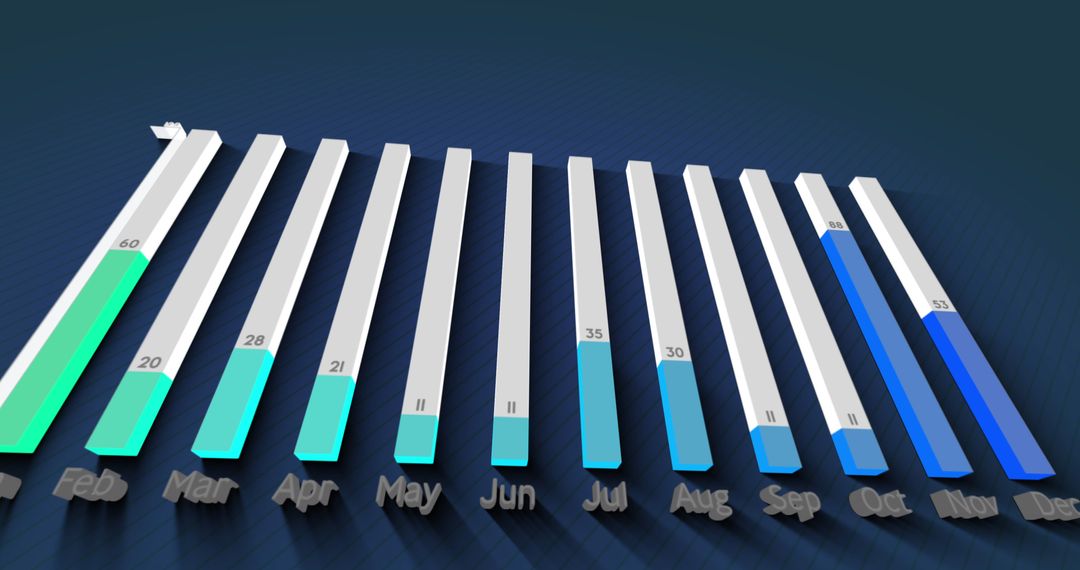
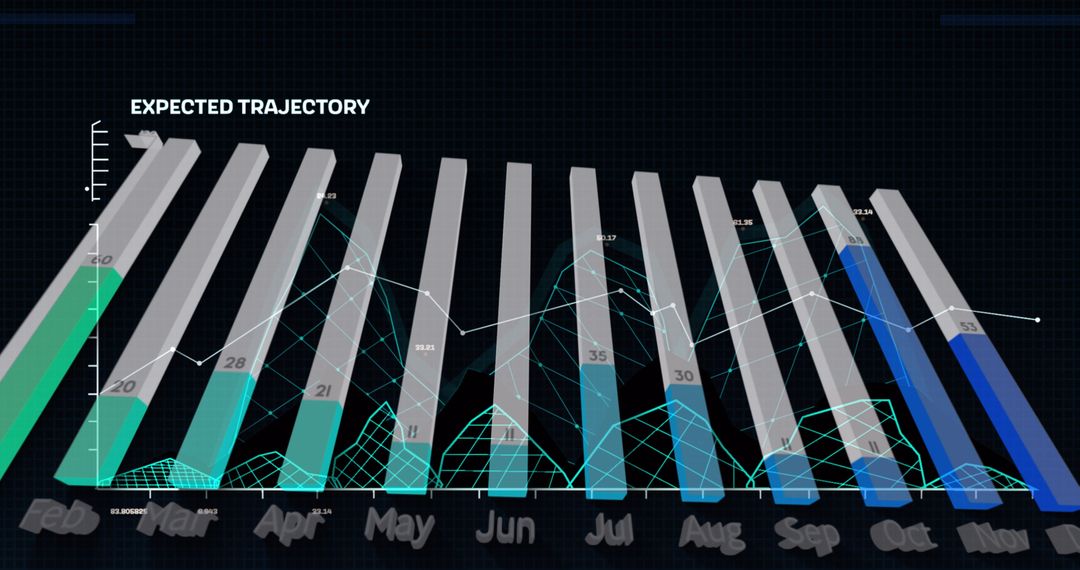
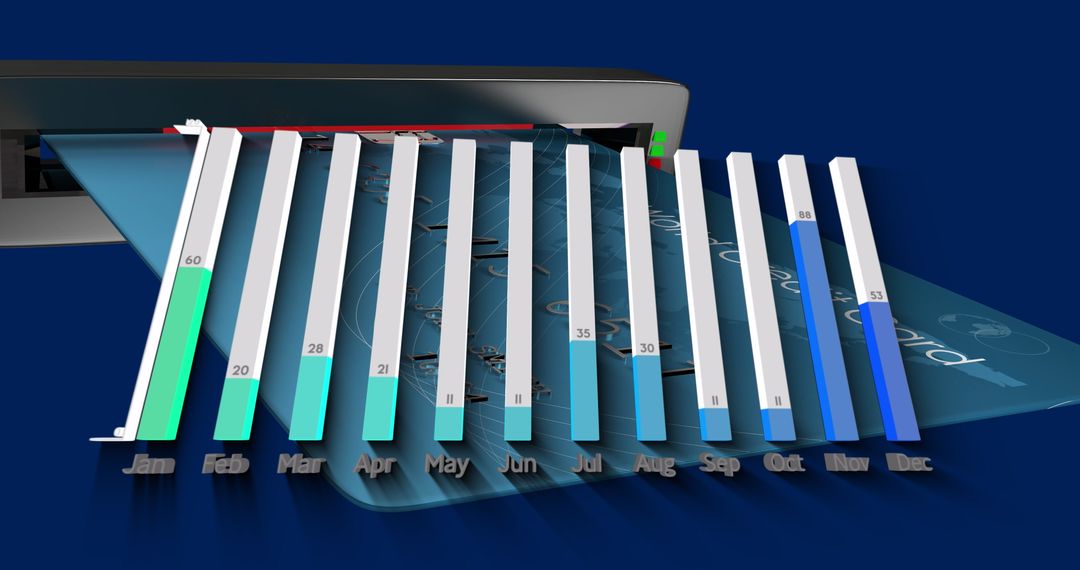
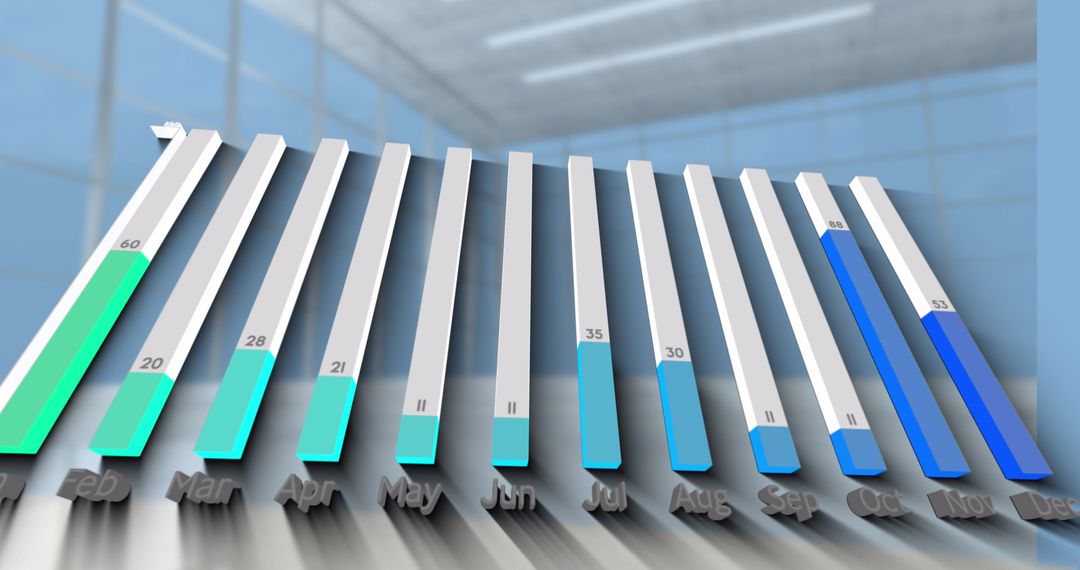
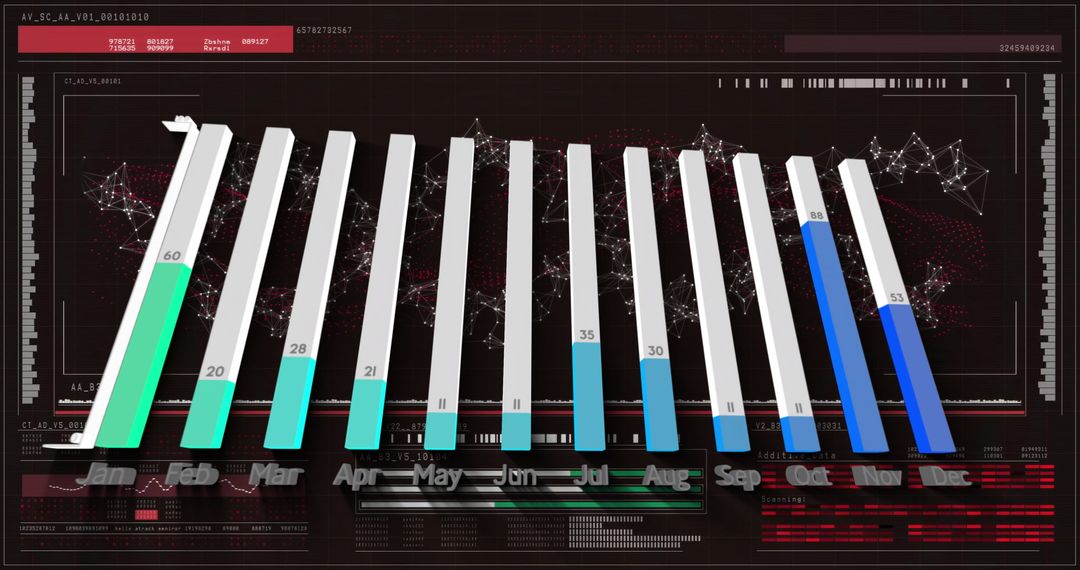
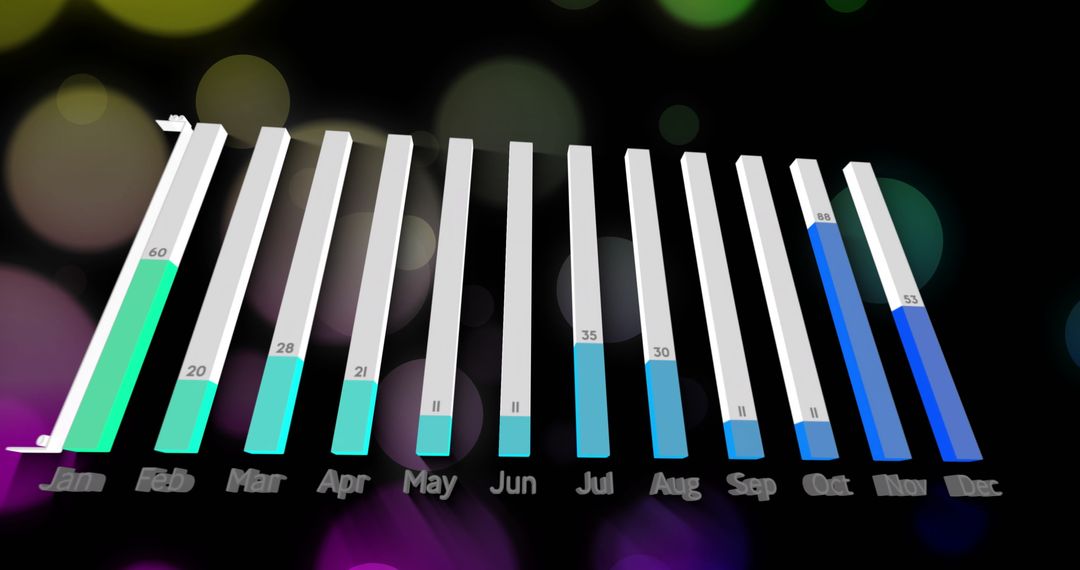
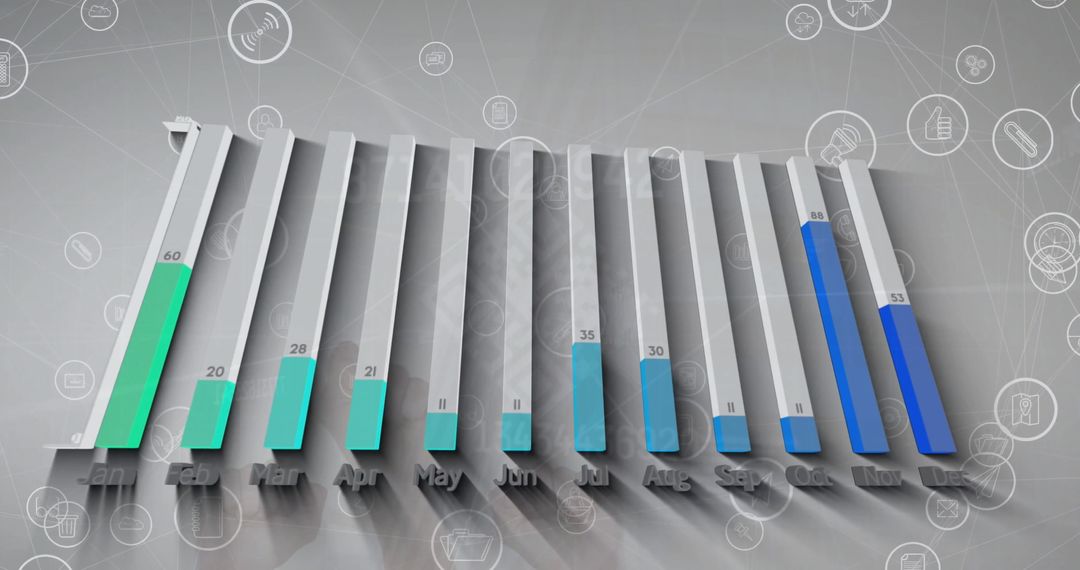
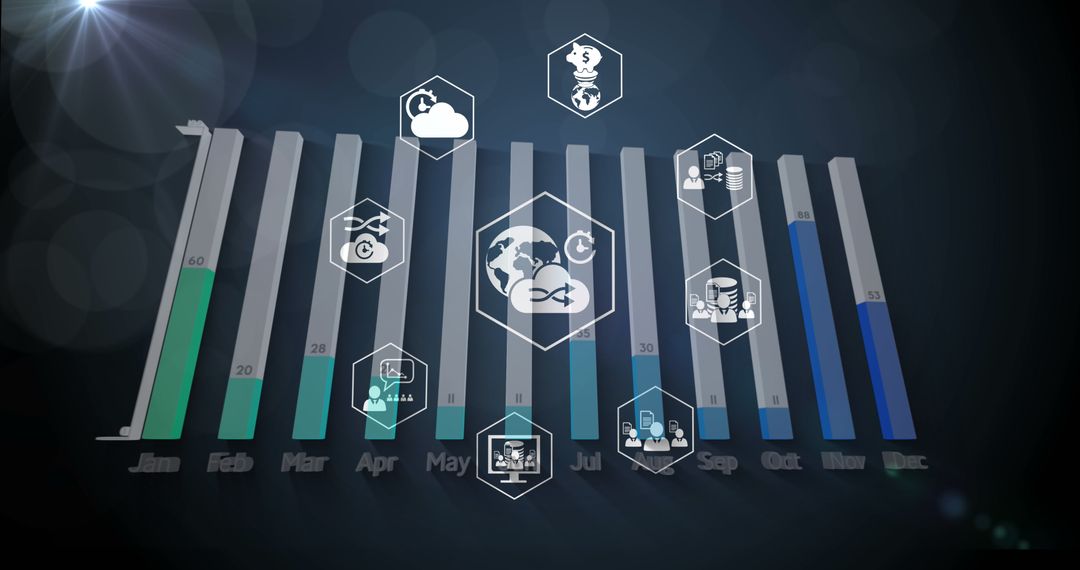
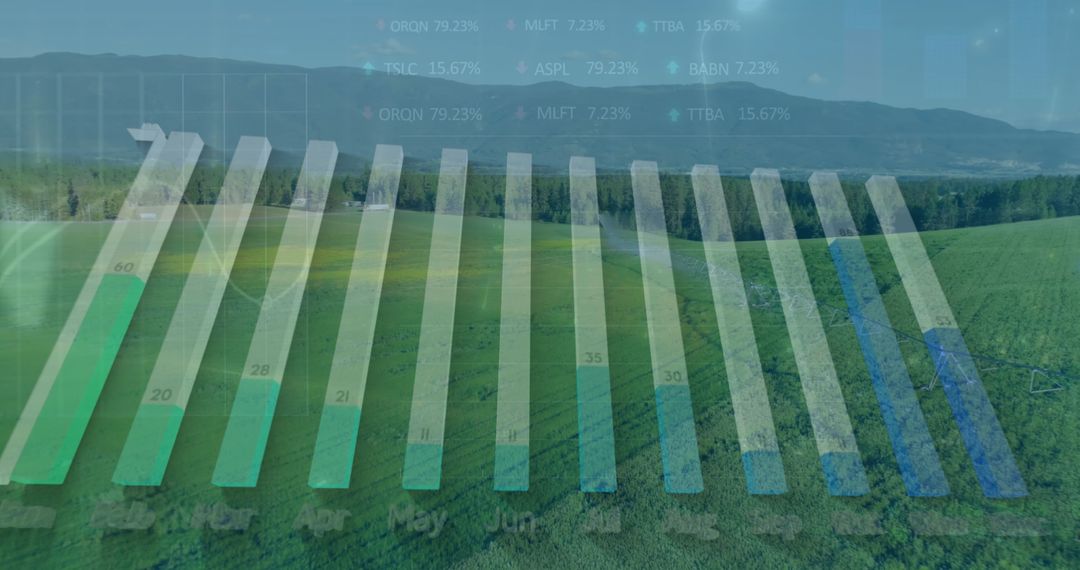
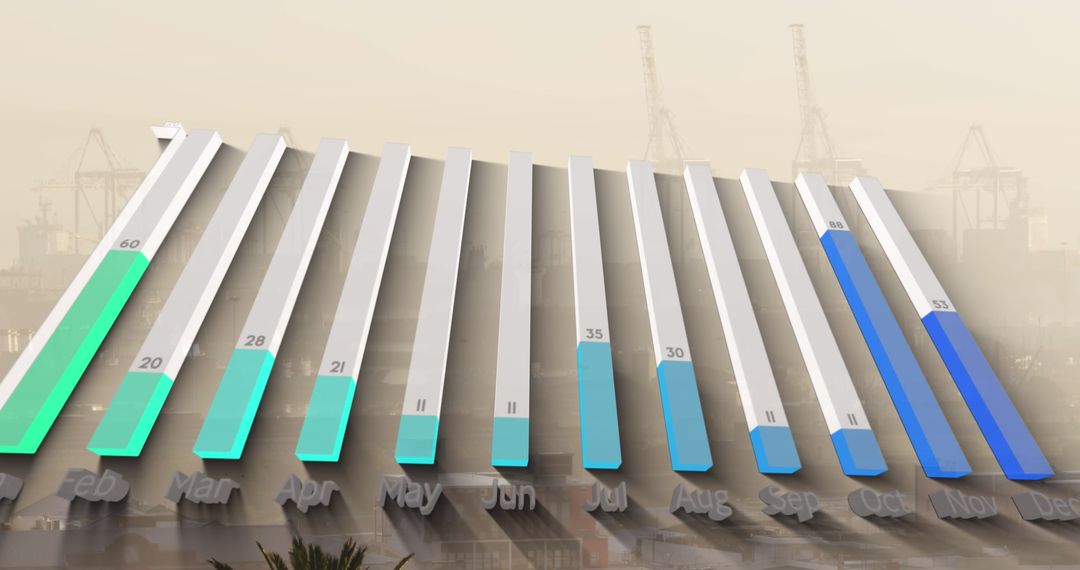
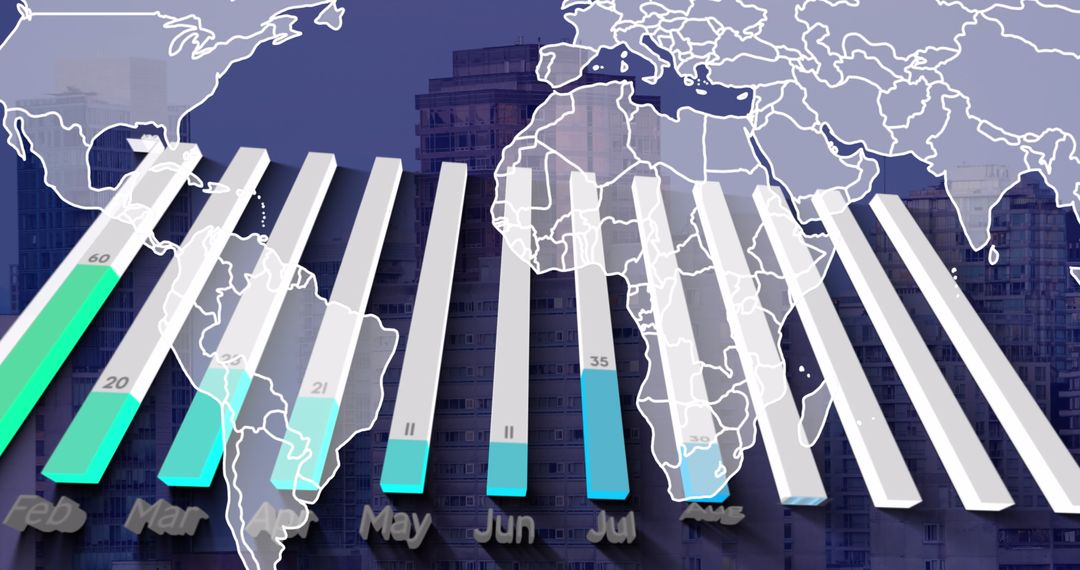
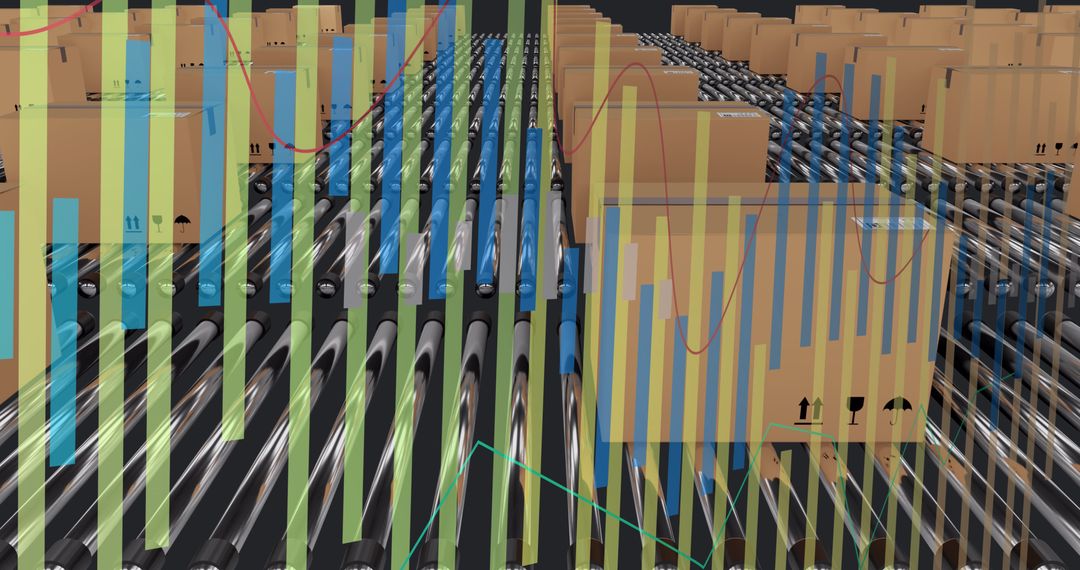
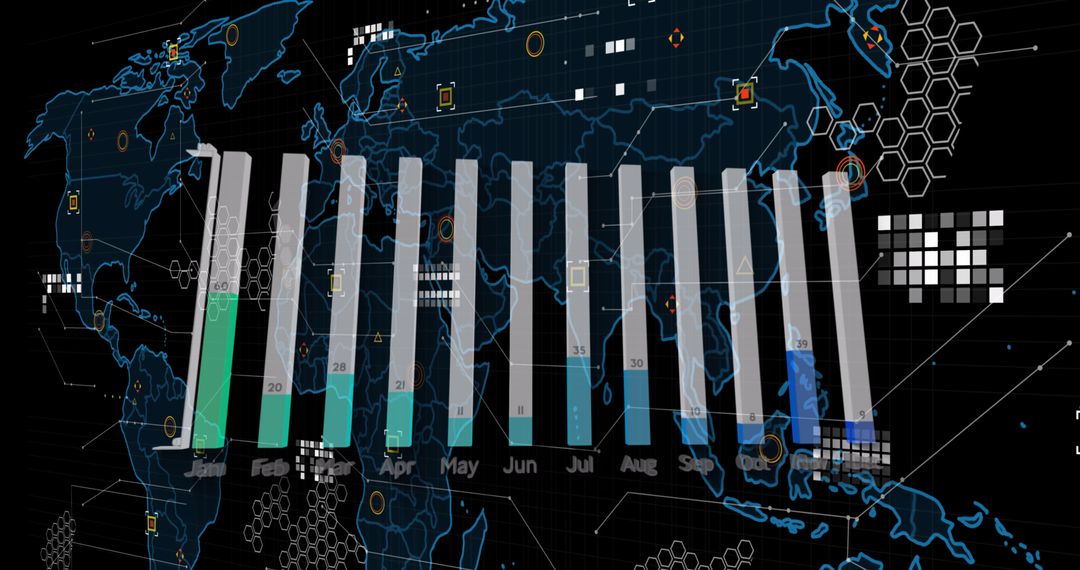
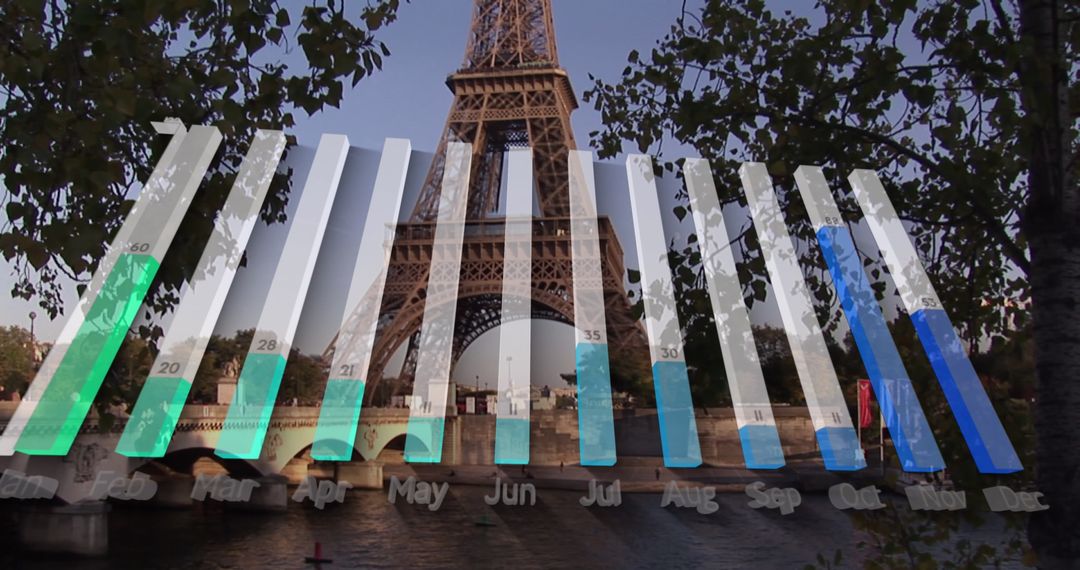
- 3D Bar Graph Displaying Monthly Business Data Analysis
3D Bar Graph Displaying Monthly Business Data Analysis Image
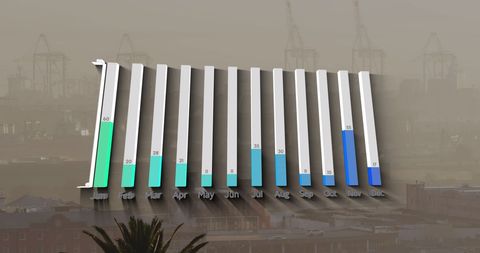
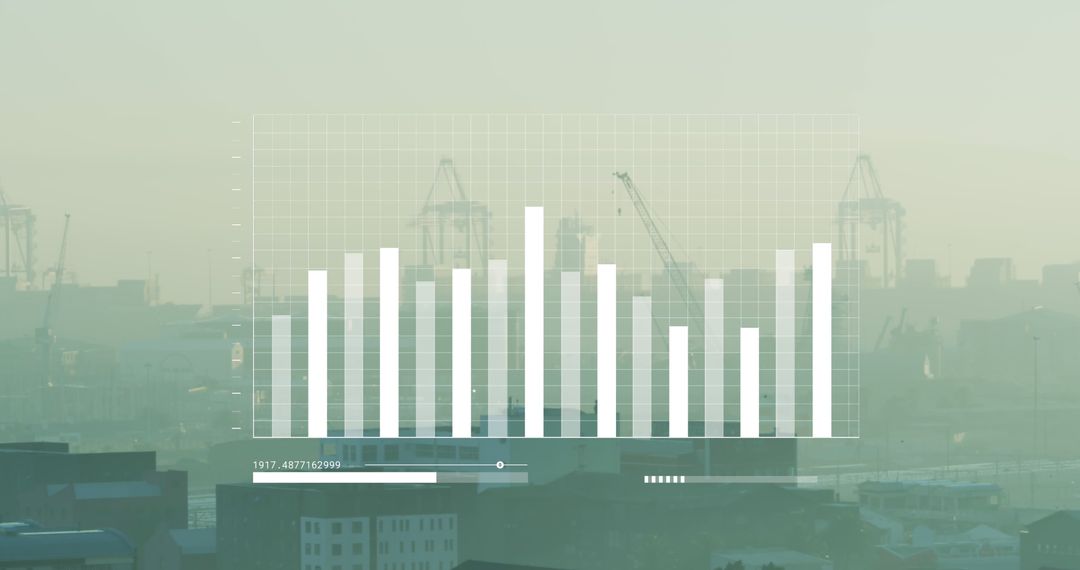
This illustration depicts a modern 3D bar graph indicating business data trends over a year, overlapped on a cityscape. Ideal for use in presentations, reports, or articles discussing economic trends, data analysis, or technological business solutions.
Powered by  - Get 15% off with code: PIKWIZARD15


2
downloads
downloads
Tags:
More
Credit Photo
If you would like to credit the Photo, here are some ways you can do so
Text Link
photo Link
<span class="text-link">
<span>
<a target="_blank" href=https://pikwizard.com/photo/3d-bar-graph-displaying-monthly-business-data-analysis/96acc552b9881dc33a87d441e2597694/>PikWizard</a>
</span>
</span>
<span class="image-link">
<span
style="margin: 0 0 20px 0; display: inline-block; vertical-align: middle; width: 100%;"
>
<a
target="_blank"
href="https://pikwizard.com/photo/3d-bar-graph-displaying-monthly-business-data-analysis/96acc552b9881dc33a87d441e2597694/"
style="text-decoration: none; font-size: 10px; margin: 0;"
>
<img src="https://pikwizard.com/pw/medium/96acc552b9881dc33a87d441e2597694.jpg" style="margin: 0; width: 100%;" alt="" />
<p style="font-size: 12px; margin: 0;">PikWizard</p>
</a>
</span>
</span>
Free (free of charge)
Free for personal and commercial use.
Author: Awesome Content
Similar Free Stock Images