- Home >
- Stock Photos >
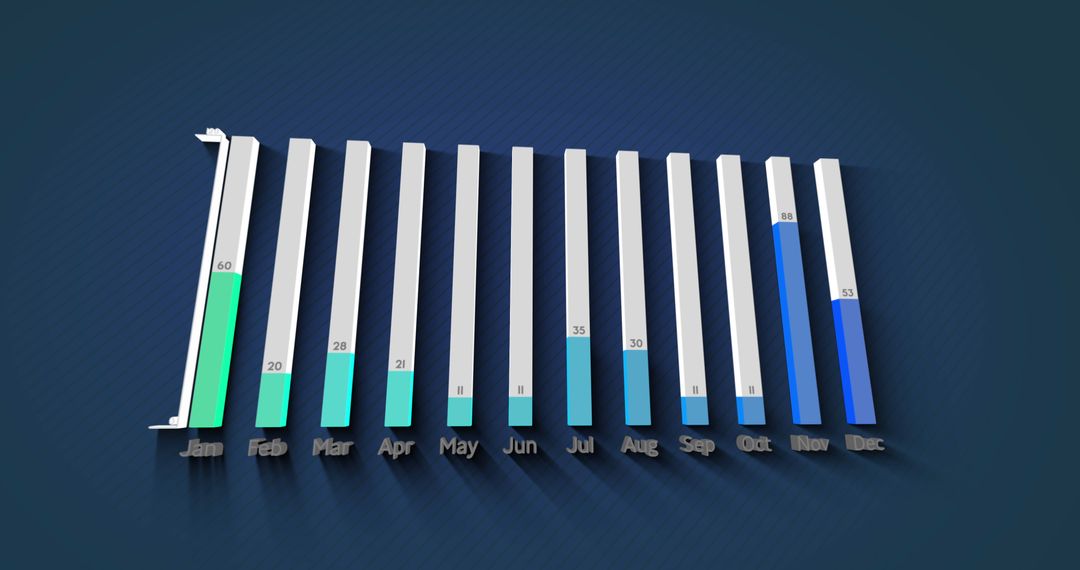
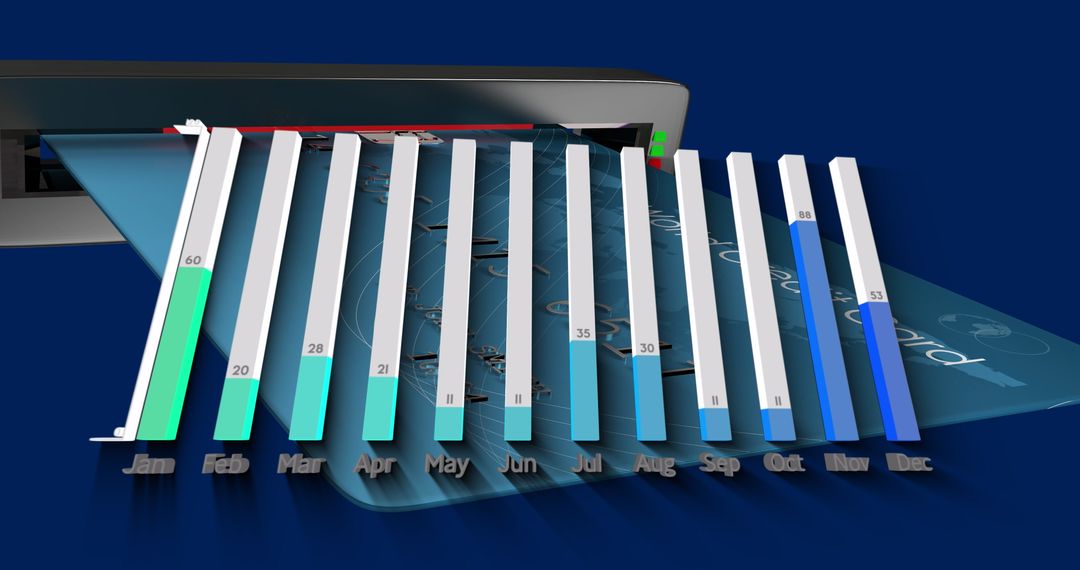
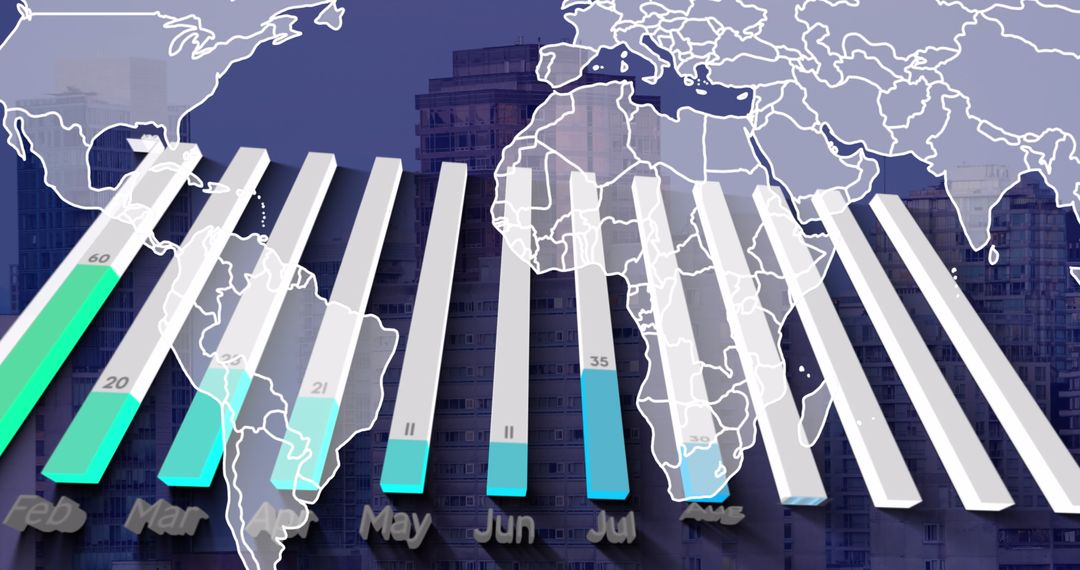
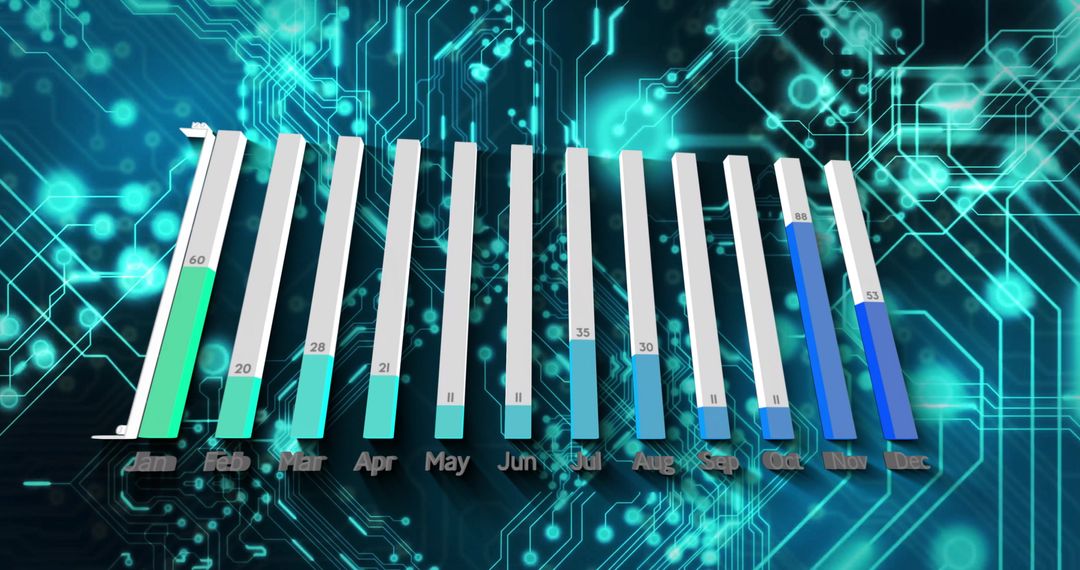
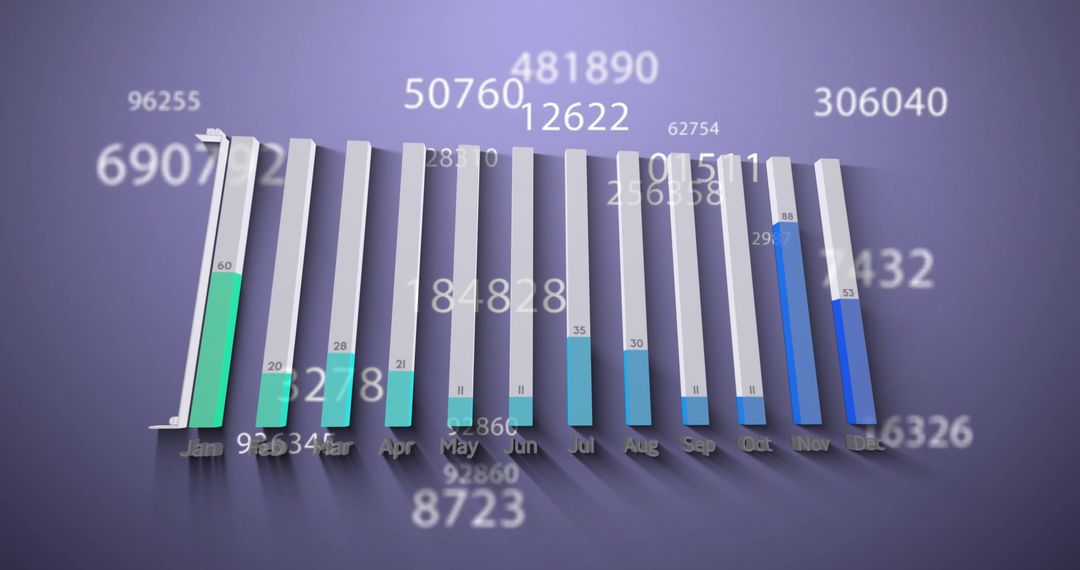
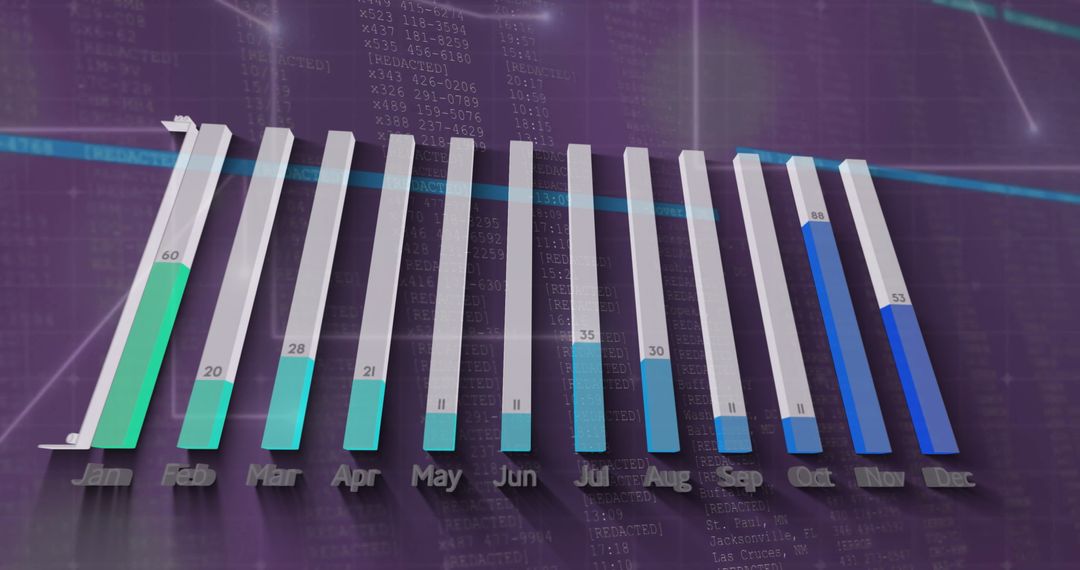
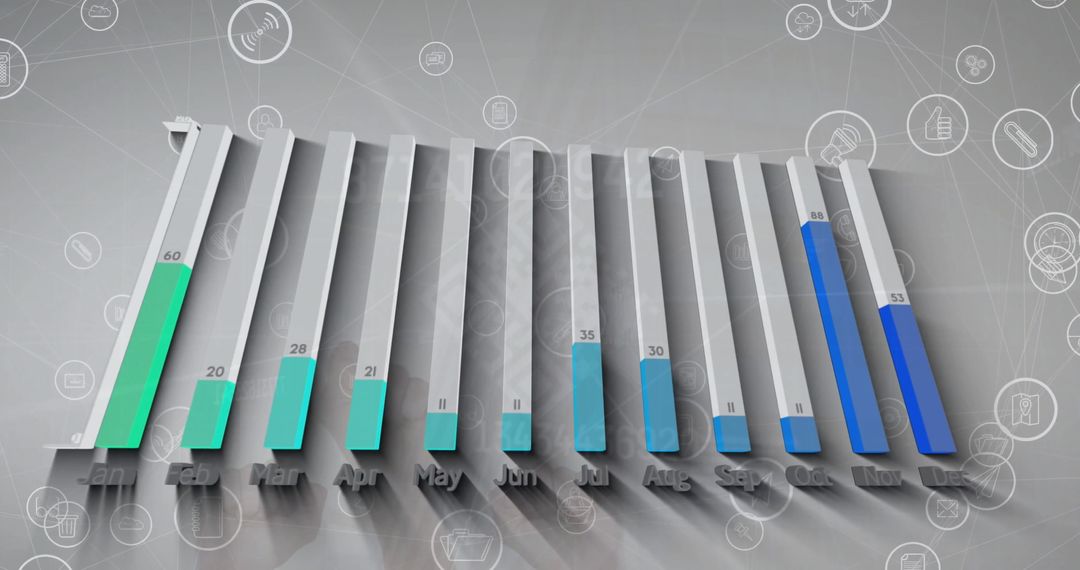
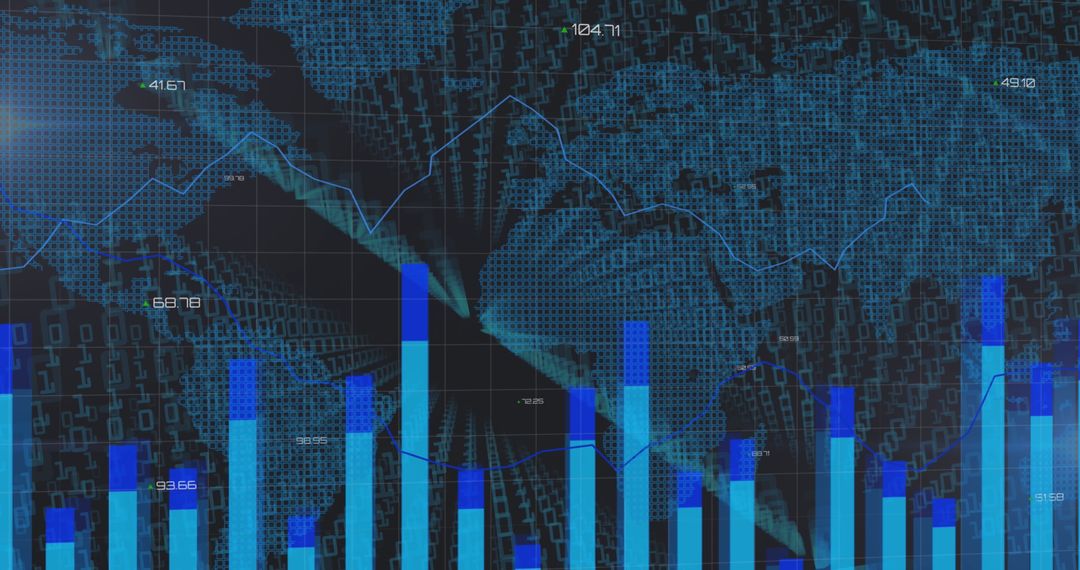
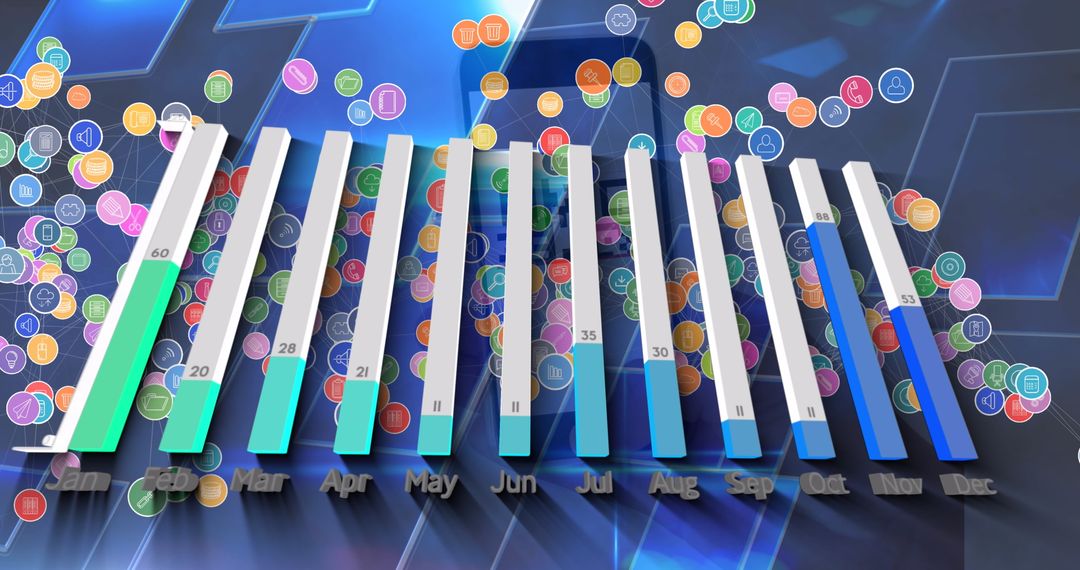
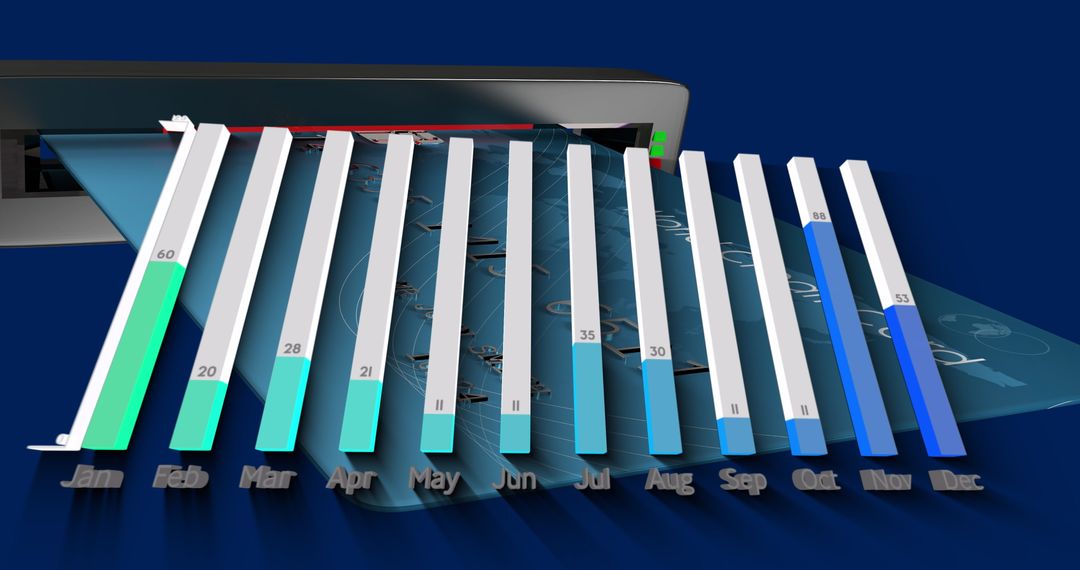
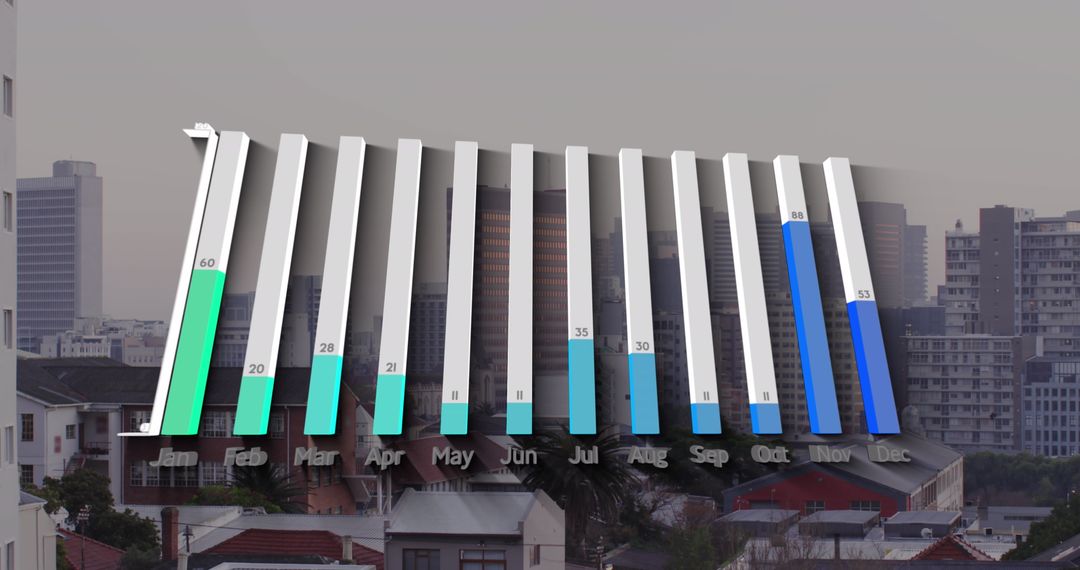
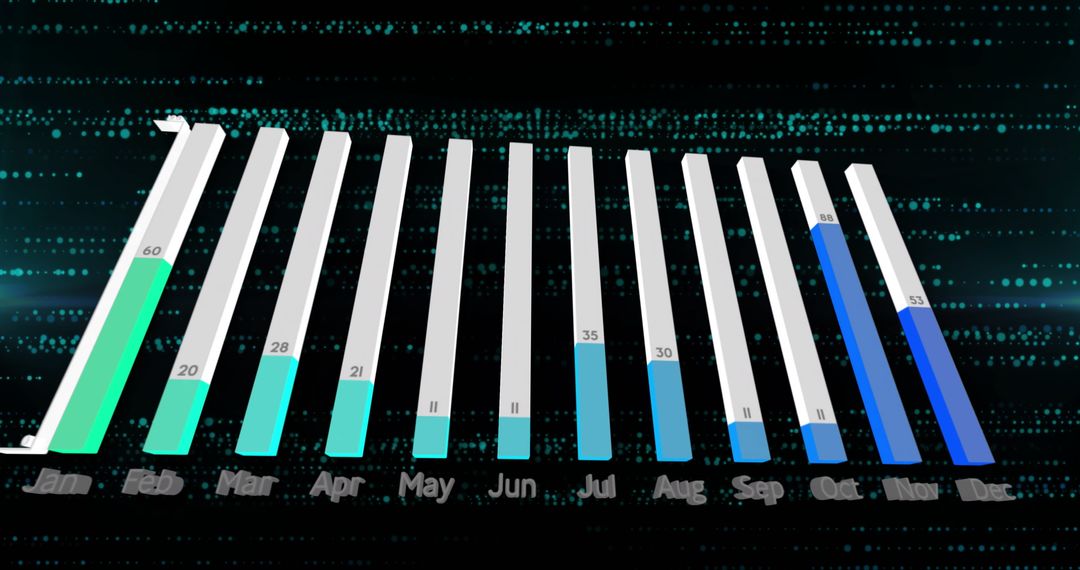
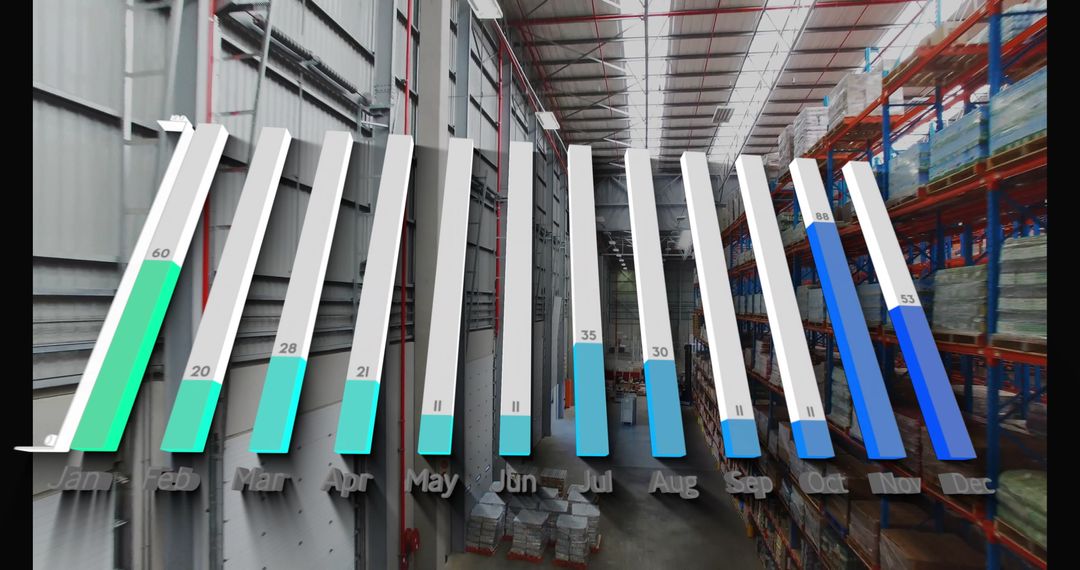
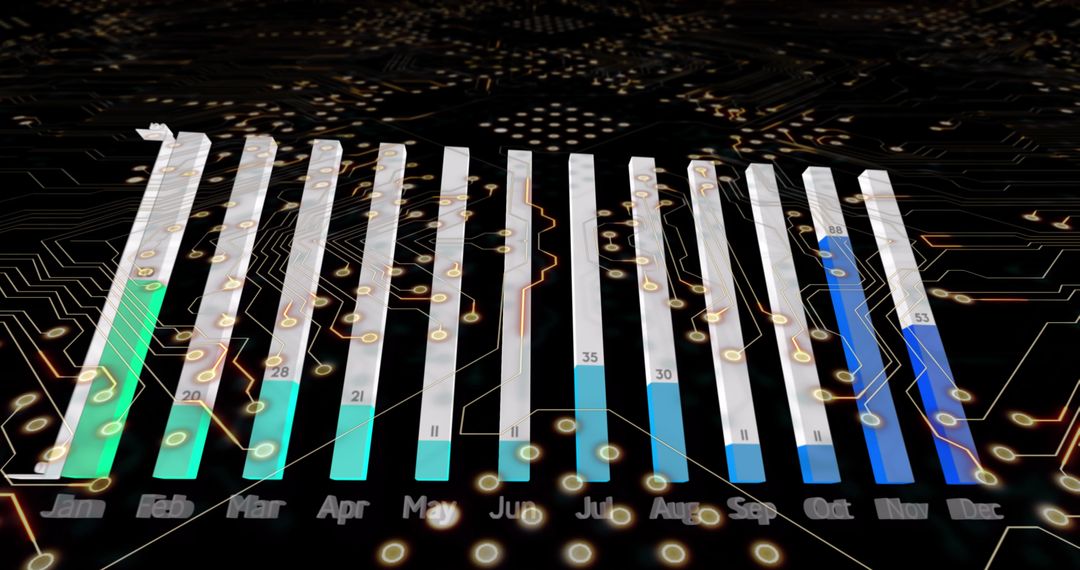
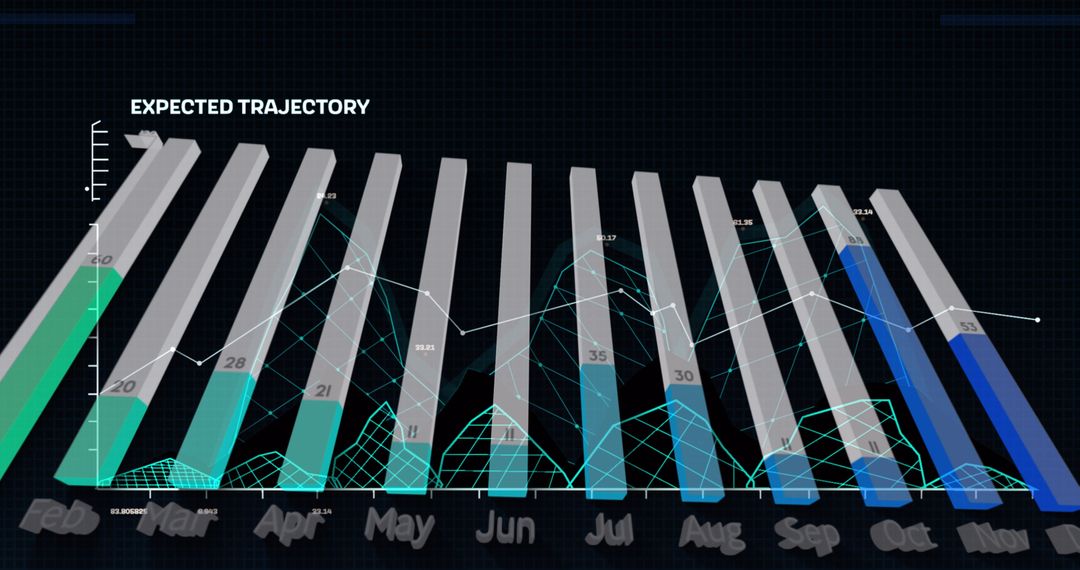
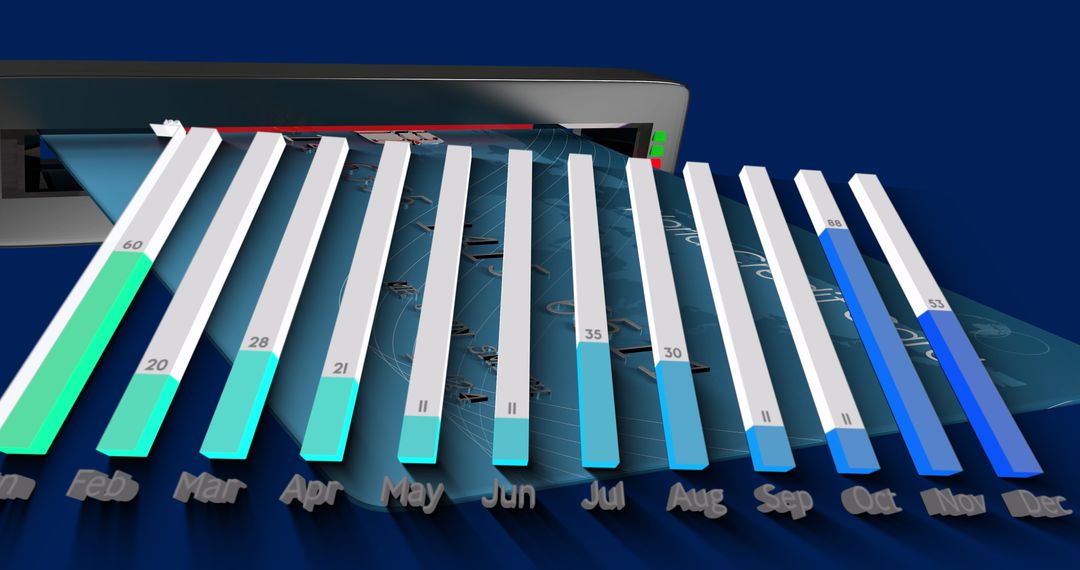
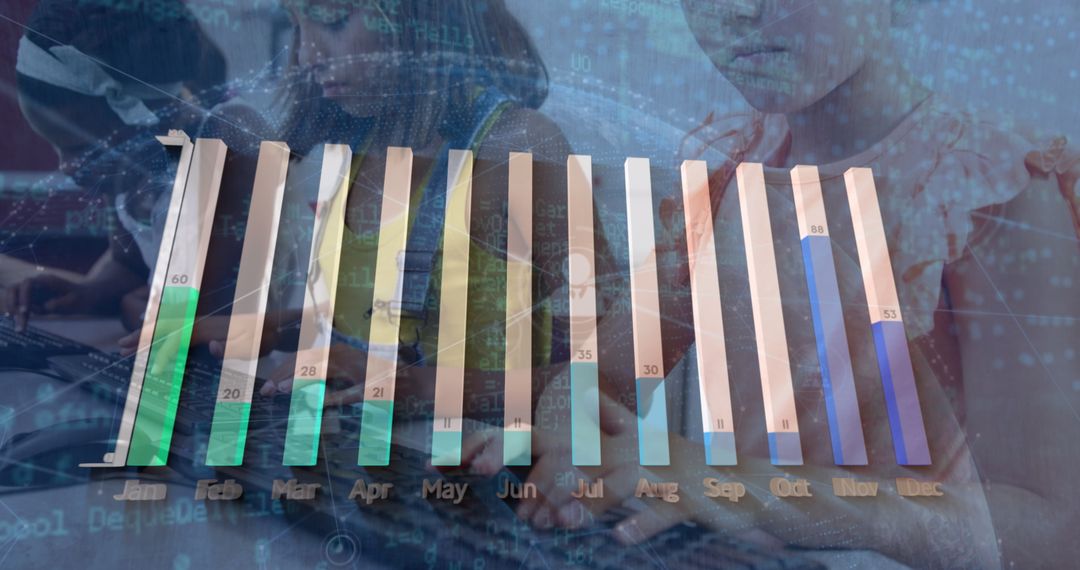
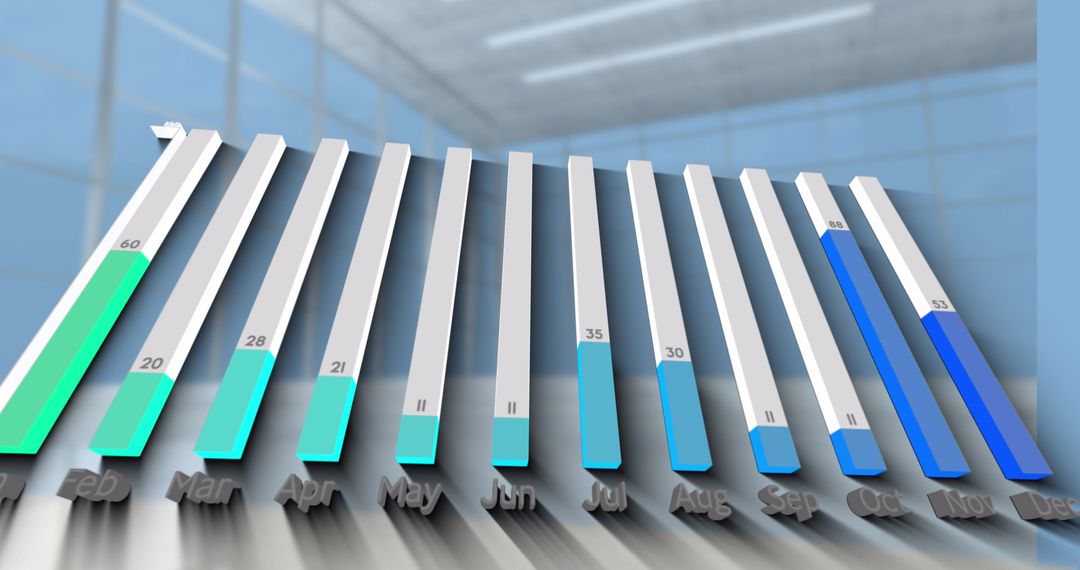
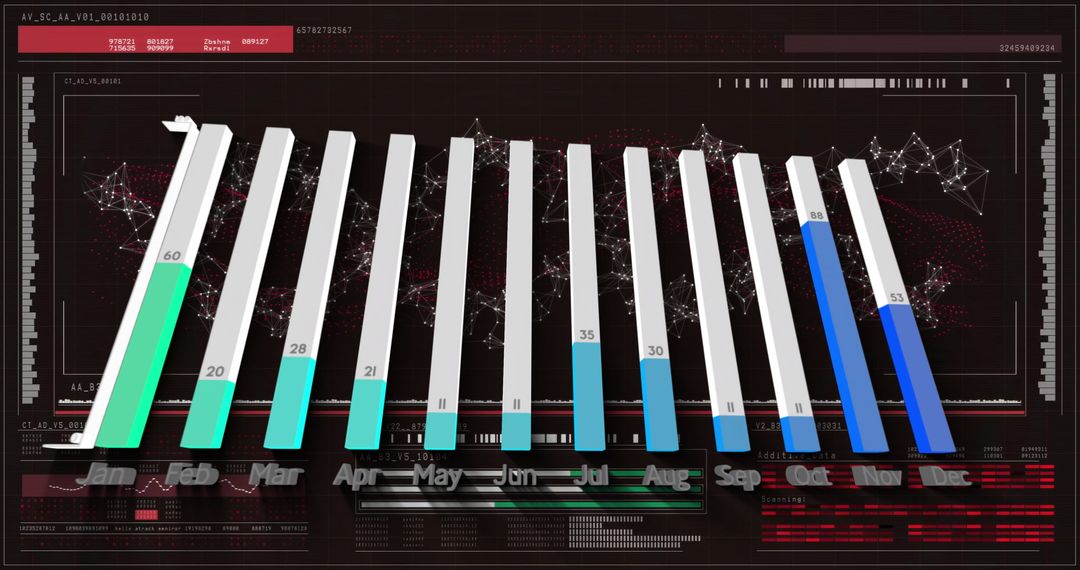
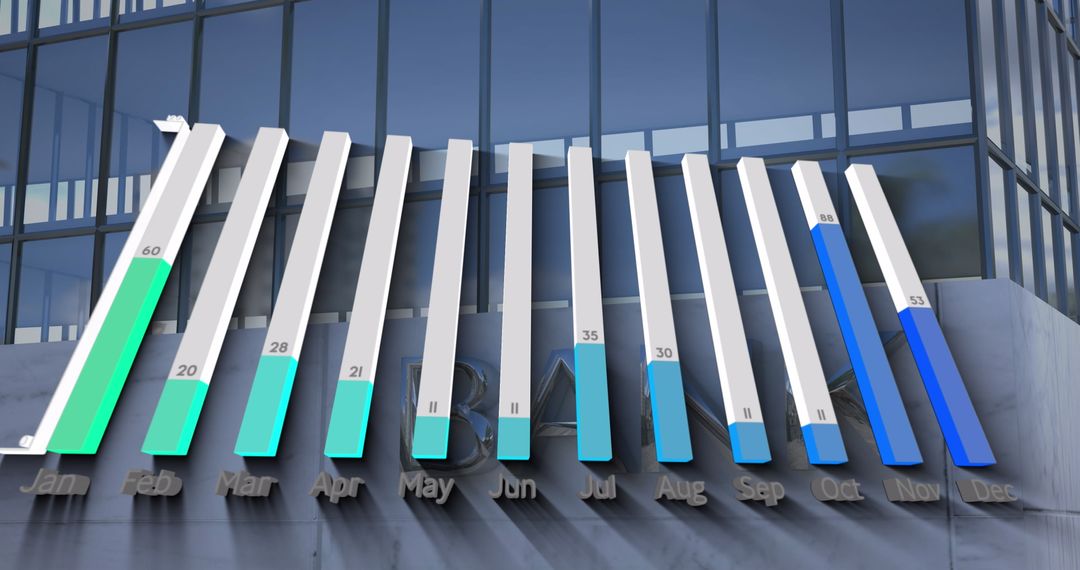
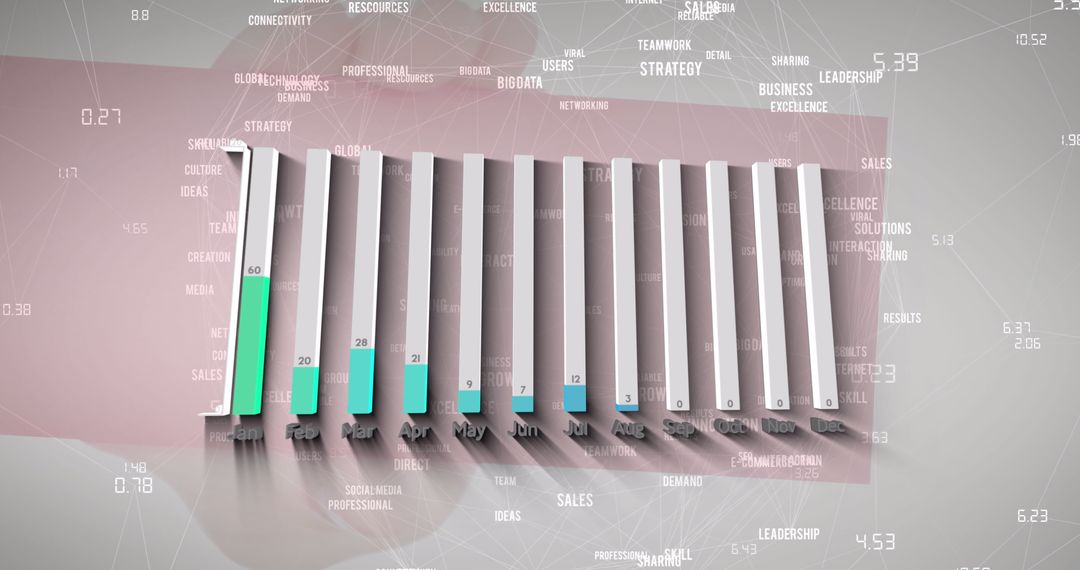
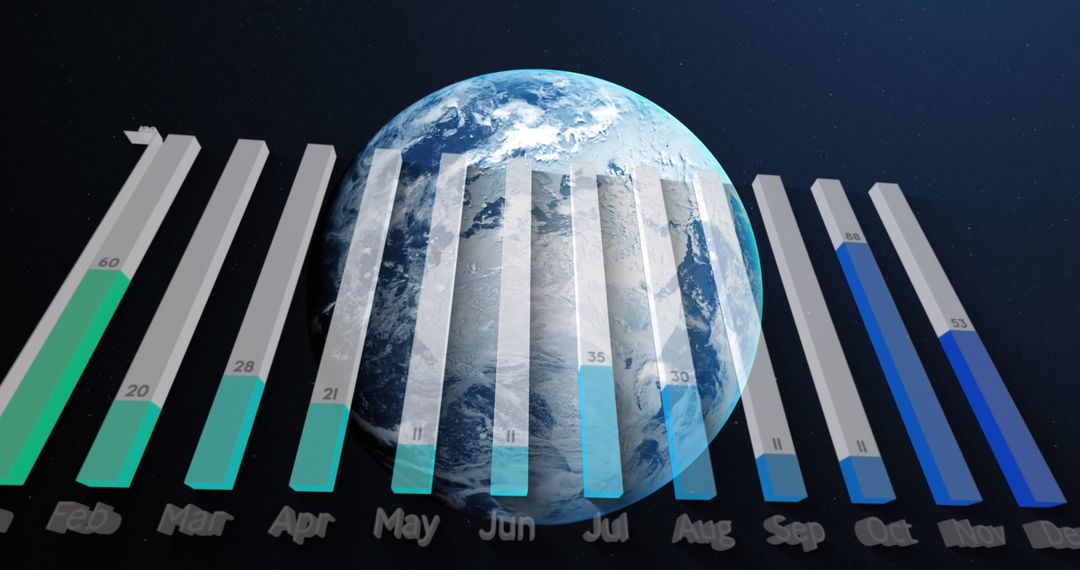
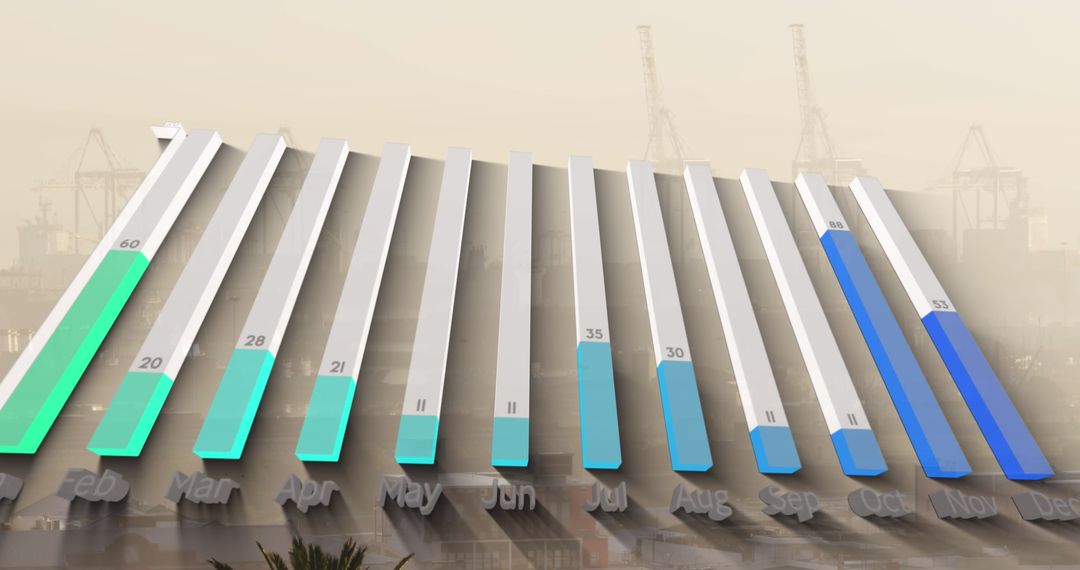
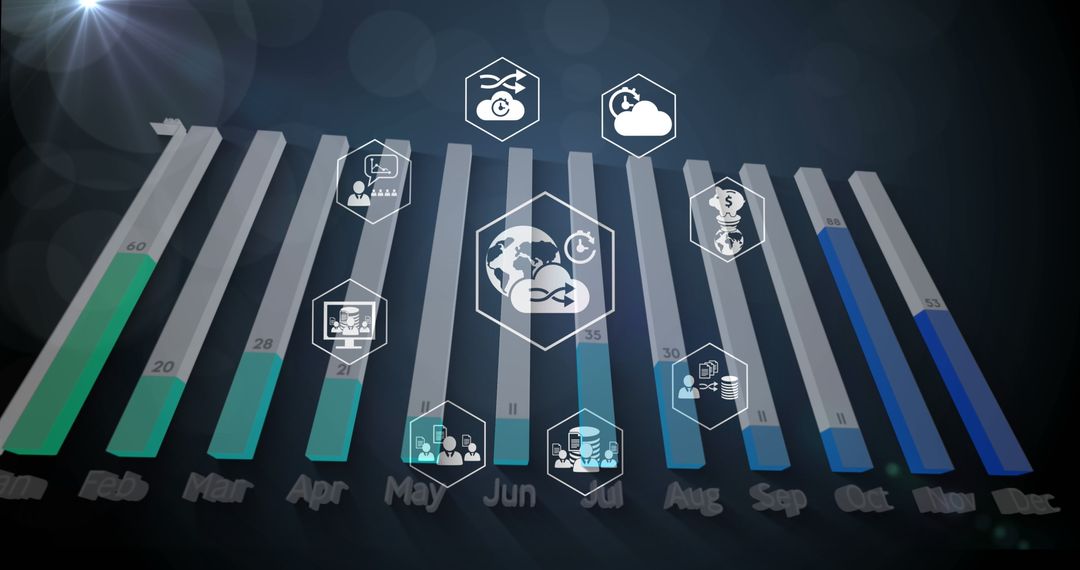
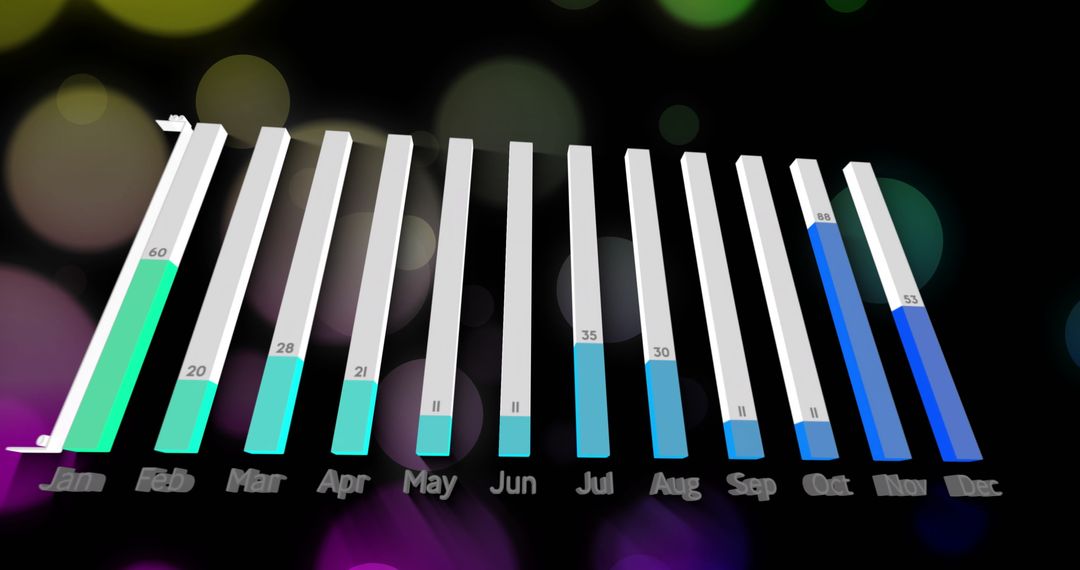
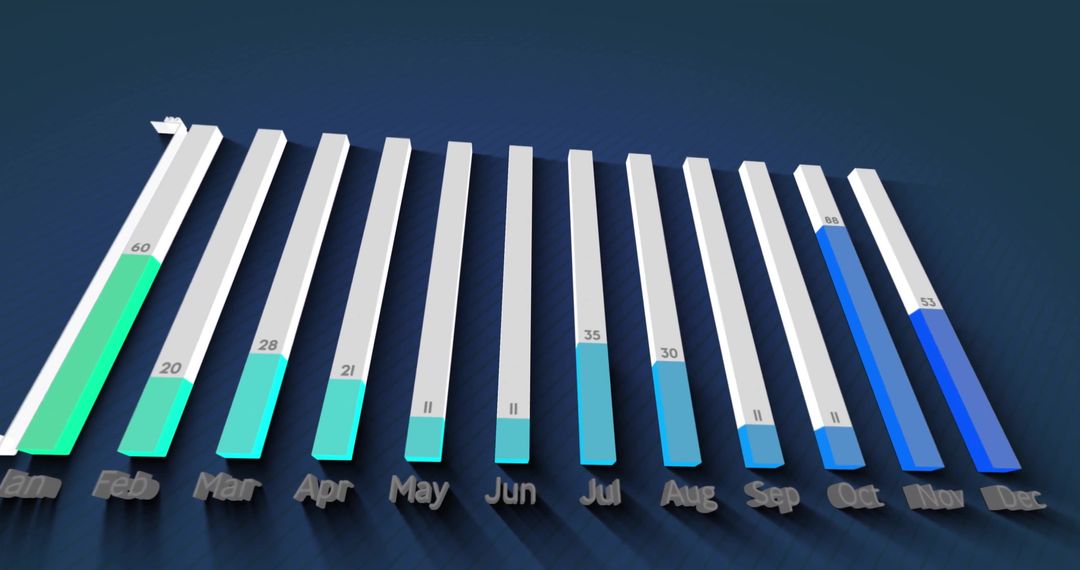
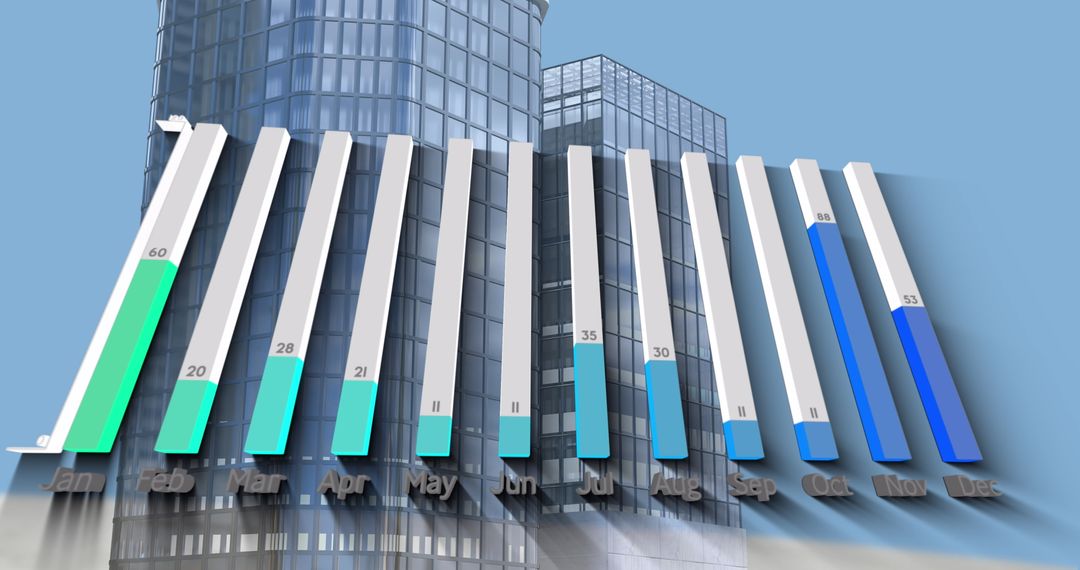
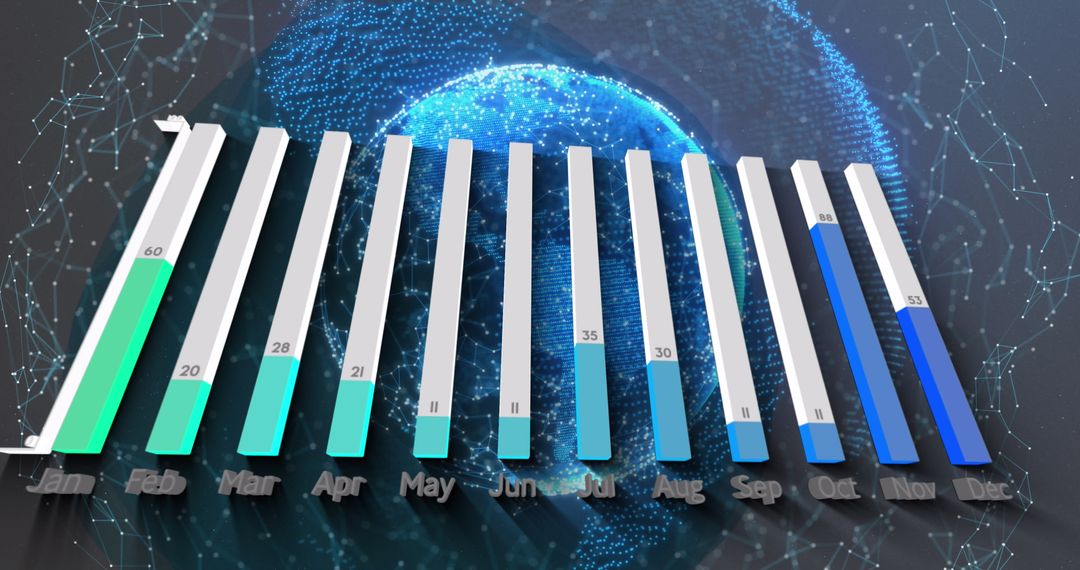
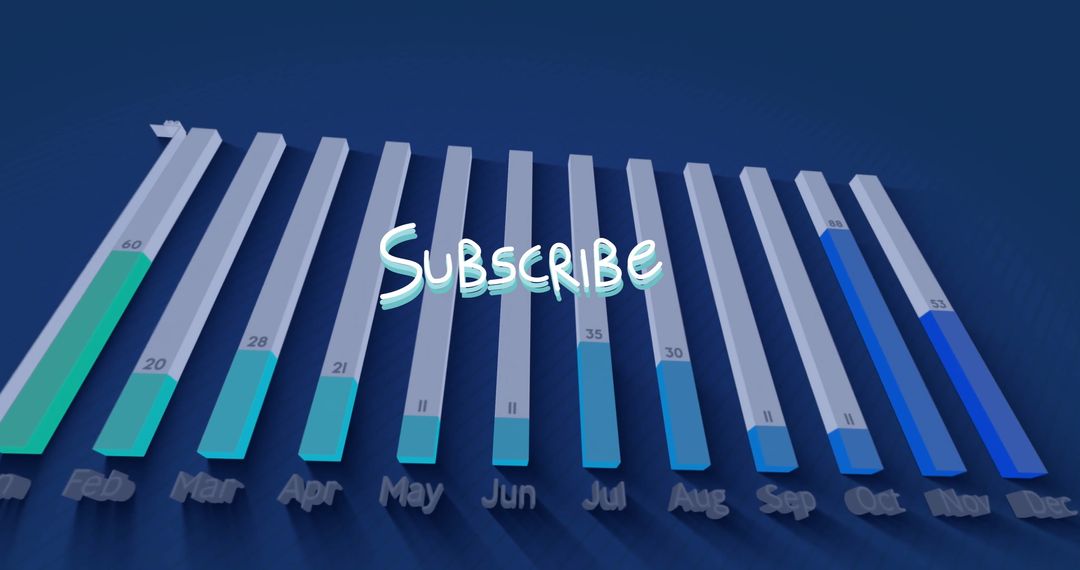
- 3D Bar Graph Illustrating Monthly Data Analysis on Blue Background
3D Bar Graph Illustrating Monthly Data Analysis on Blue Background Image

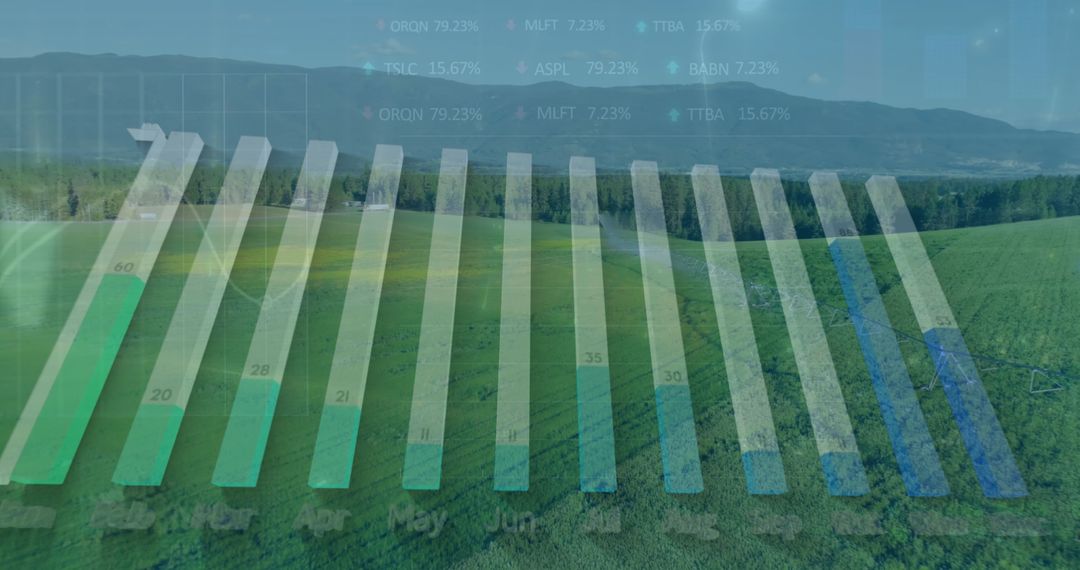
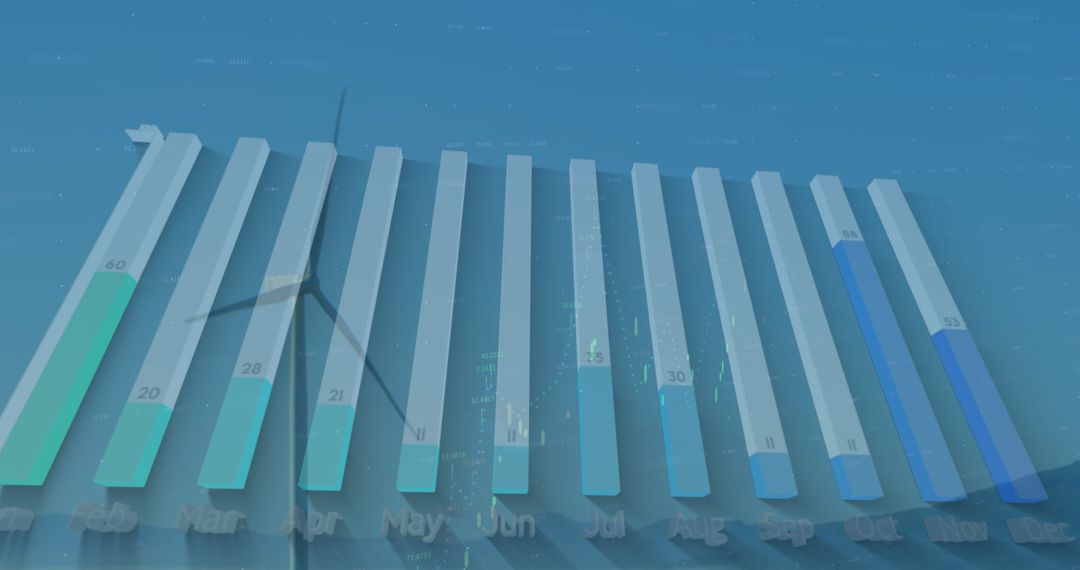
Modern 3D bar graph design displaying monthly data distribution on a digital interface background. Useful for illustrating trends, statistical analysis figures, business reports, data insights presentations, and academic materials. The futuristic and colorful style makes it appealing for tech-related content creation and global business visualizations.
Powered by  - Get 15% off with code: PIKWIZARD15


4
downloads
downloads
Tags:
More
Credit Photo
If you would like to credit the Photo, here are some ways you can do so
Text Link
photo Link
<span class="text-link">
<span>
<a target="_blank" href=https://pikwizard.com/photo/3d-bar-graph-illustrating-monthly-data-analysis-on-blue-background/678a99d03baa5c6723bc1089646ef54c/>PikWizard</a>
</span>
</span>
<span class="image-link">
<span
style="margin: 0 0 20px 0; display: inline-block; vertical-align: middle; width: 100%;"
>
<a
target="_blank"
href="https://pikwizard.com/photo/3d-bar-graph-illustrating-monthly-data-analysis-on-blue-background/678a99d03baa5c6723bc1089646ef54c/"
style="text-decoration: none; font-size: 10px; margin: 0;"
>
<img src="https://pikwizard.com/pw/medium/678a99d03baa5c6723bc1089646ef54c.jpg" style="margin: 0; width: 100%;" alt="" />
<p style="font-size: 12px; margin: 0;">PikWizard</p>
</a>
</span>
</span>
Free (free of charge)
Free for personal and commercial use.
Author: Authentic Images
Similar Free Stock Images