
- Home >
- Stock Photos >
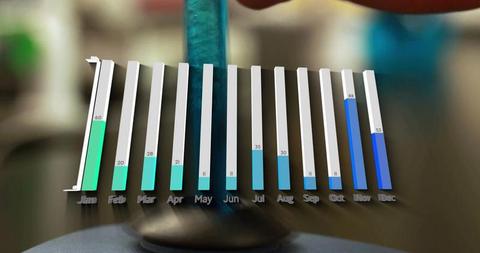
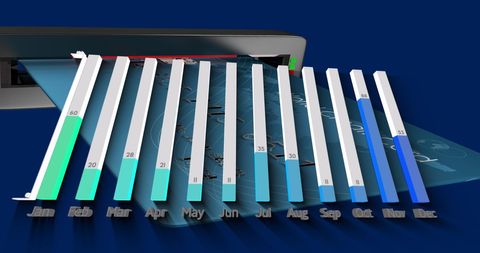
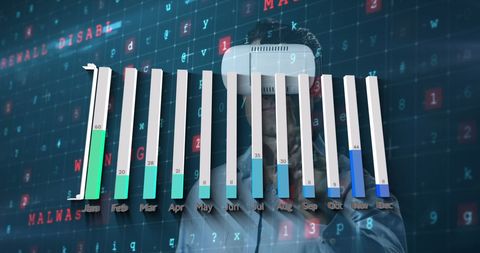
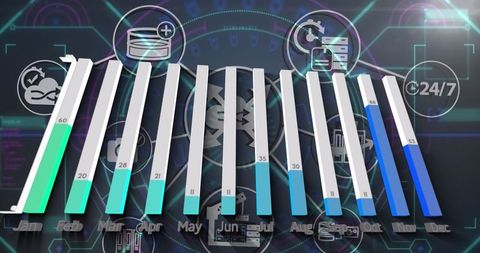
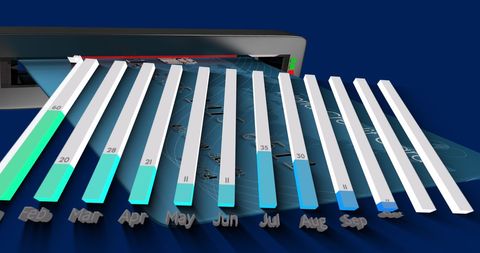
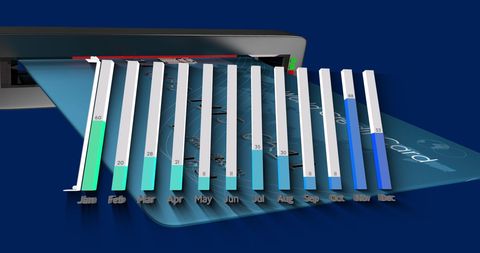
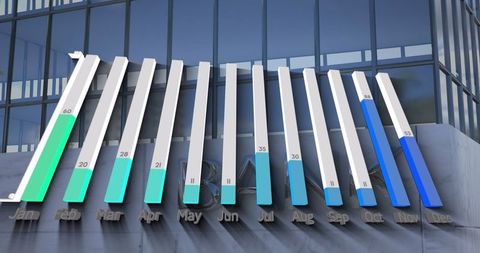
- 3D Bar Graph Reflecting Monthly Data Over Computer Keyboard
3D Bar Graph Reflecting Monthly Data Over Computer Keyboard Image
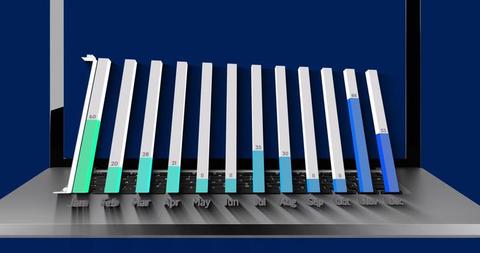
This abstract visualization showcases a digital bar graph representing data over twelve months, superimposed on a computer keyboard backdrop. Ideal for presentations focusing on data analysis, statistics, global communication, or digital technology-related topics. This image suits articles, reports, or educational materials illustrating data trends over time. Perfect for conveying progress, computation, and business insights.
Powered by  - Get 15% off with code: PIKWIZARD15


downloads
Tags:
More
Credit Photo
If you would like to credit the Photo, here are some ways you can do so
Text Link
photo Link
<span class="text-link">
<span>
<a target="_blank" href=https://pikwizard.com/photo/3d-bar-graph-reflecting-monthly-data-over-computer-keyboard/6222610076c36db1ed97af7c9181b0f7/>PikWizard</a>
</span>
</span>
<span class="image-link">
<span
style="margin: 0 0 20px 0; display: inline-block; vertical-align: middle; width: 100%;"
>
<a
target="_blank"
href="https://pikwizard.com/photo/3d-bar-graph-reflecting-monthly-data-over-computer-keyboard/6222610076c36db1ed97af7c9181b0f7/"
style="text-decoration: none; font-size: 10px; margin: 0;"
>
<img src="https://pikwizard.com/pw/medium/6222610076c36db1ed97af7c9181b0f7.jpg" style="margin: 0; width: 100%;" alt="" />
<p style="font-size: 12px; margin: 0;">PikWizard</p>
</a>
</span>
</span>
Free (free of charge)
Free for personal and commercial use.
Author: Awesome Content
Similar Free Stock Images
Loading...


Premium


Premium


Premium

Premium


Premium


Premium

Premium


Premium


Premium


Premium

Premium


Premium


Premium


Premium

Premium


Premium

Premium

Premium

Premium

Premium


Premium


Premium


Premium


Premium

Premium


Explore More Free Stock Images