- Home >
- Stock Photos >
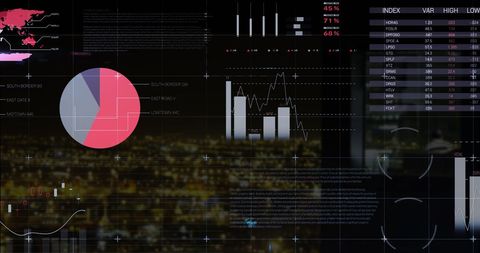
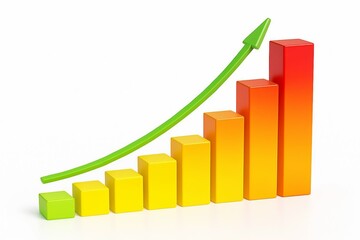
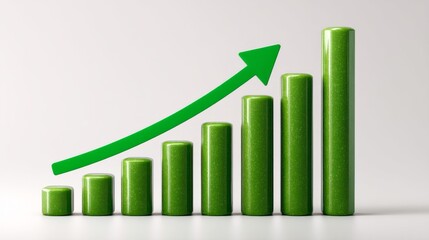
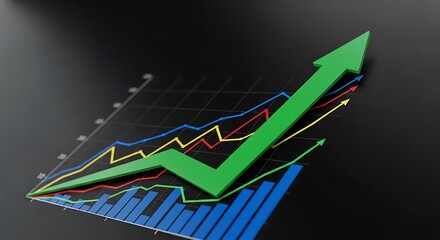
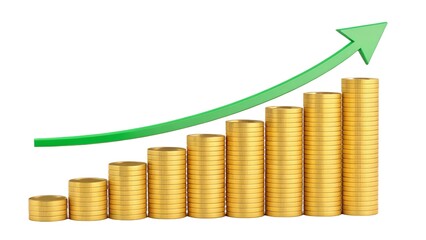
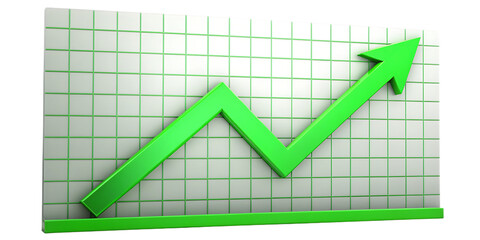
- 3D Bar Graph with Green Arrow Showing Economic Growth
3D Bar Graph with Green Arrow Showing Economic Growth Image
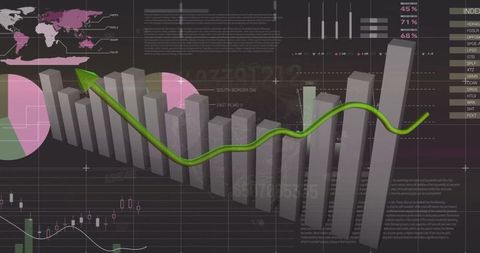
Futuristic illustration depicting financial success and upward trends, ideal for finance, cryptocurrency trading, business reports, market analysis publications. Useful in presentations highlighting economic growth, profit increases, or positive forecasts.
Powered by 


downloads
Tags:
More
Credit Photo
If you would like to credit the Photo, here are some ways you can do so
Text Link
photo Link
<span class="text-link">
<span>
<a target="_blank" href=https://pikwizard.com/photo/3d-bar-graph-with-green-arrow-showing-economic-growth/84b98f9db31802831a6503bf5190ae62/>PikWizard</a>
</span>
</span>
<span class="image-link">
<span
style="margin: 0 0 20px 0; display: inline-block; vertical-align: middle; width: 100%;"
>
<a
target="_blank"
href="https://pikwizard.com/photo/3d-bar-graph-with-green-arrow-showing-economic-growth/84b98f9db31802831a6503bf5190ae62/"
style="text-decoration: none; font-size: 10px; margin: 0;"
>
<img src="https://pikwizard.com/pw/medium/84b98f9db31802831a6503bf5190ae62.jpg" style="margin: 0; width: 100%;" alt="" />
<p style="font-size: 12px; margin: 0;">PikWizard</p>
</a>
</span>
</span>
Free (free of charge)
Free for personal and commercial use.
Author: Awesome Content
Similar Free Stock Images
Loading...
Premium


Premium


Premium


Premium


Premium


Premium

Premium


Premium

Premium

Premium


Premium


Premium


Premium
Premium

Premium


Premium

Premium


Premium

Premium


Premium


Premium


Premium


Premium


Premium


Premium