
- Home >
- Stock Photos >
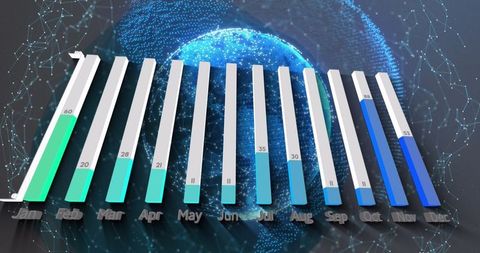
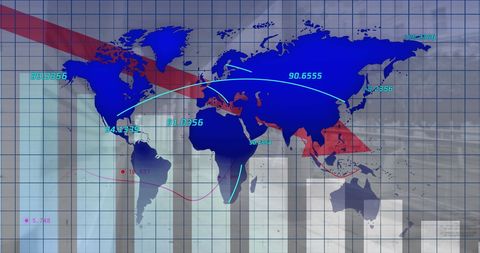
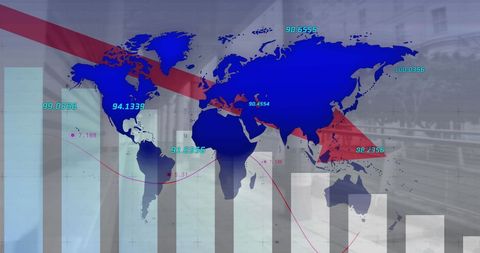
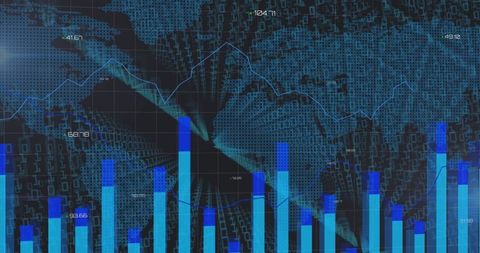
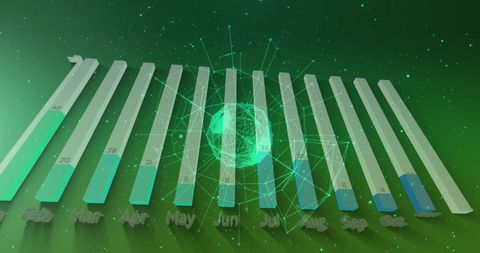
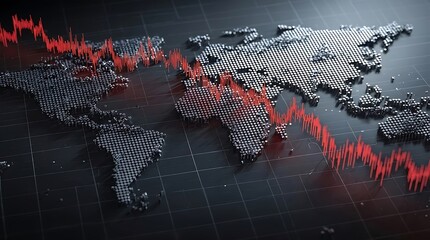
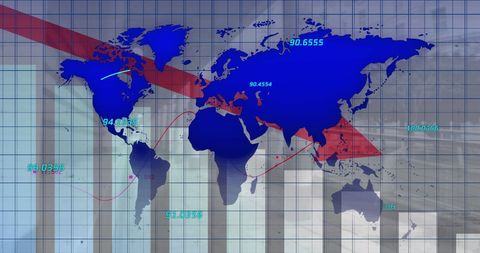
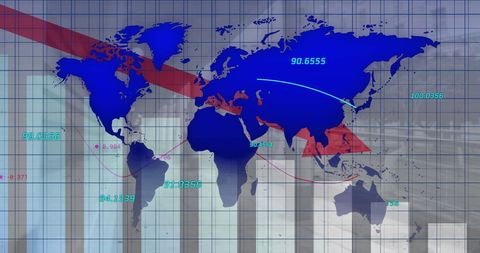
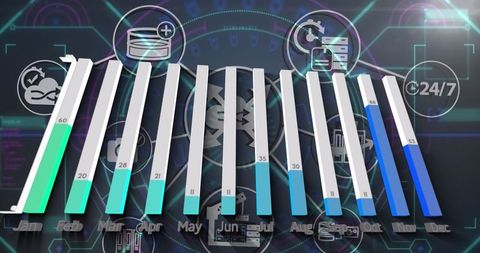
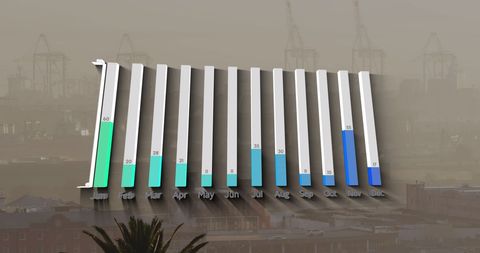
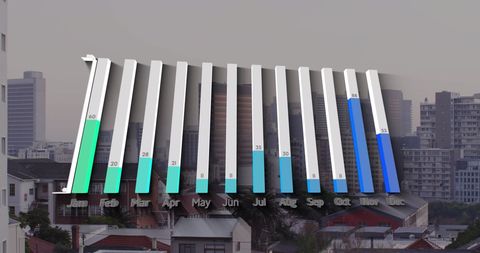
- 3D Bar Graphs over World Map Showcasing Data Trends
3D Bar Graphs over World Map Showcasing Data Trends Image
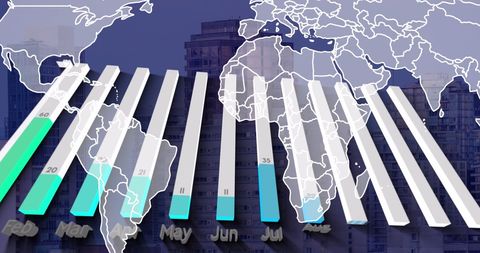
This visual portrays interconnectedness through 3D bar graphs overlaying a world map, symbolizing global data flow and analysis. Perfect for use in business reports, presentations on international analytics, educational materials about data visualization, and promotional content for digital analysis tools.
Powered by 


downloads
Tags:
More
Credit Photo
If you would like to credit the Photo, here are some ways you can do so
Text Link
photo Link
<span class="text-link">
<span>
<a target="_blank" href=https://pikwizard.com/photo/3d-bar-graphs-over-world-map-showcasing-data-trends/804a18aec93e8f7f02ea654909c272e1/>PikWizard</a>
</span>
</span>
<span class="image-link">
<span
style="margin: 0 0 20px 0; display: inline-block; vertical-align: middle; width: 100%;"
>
<a
target="_blank"
href="https://pikwizard.com/photo/3d-bar-graphs-over-world-map-showcasing-data-trends/804a18aec93e8f7f02ea654909c272e1/"
style="text-decoration: none; font-size: 10px; margin: 0;"
>
<img src="https://pikwizard.com/pw/medium/804a18aec93e8f7f02ea654909c272e1.jpg" style="margin: 0; width: 100%;" alt="" />
<p style="font-size: 12px; margin: 0;">PikWizard</p>
</a>
</span>
</span>
Free (free of charge)
Free for personal and commercial use.
Author: Authentic Images
Similar Free Stock Images

Premium


Premium


Premium


Premium


Premium


Premium


Premium


Premium

Premium


Premium


Premium


Premium


Premium

Premium

Premium


Premium

Premium


Premium


Premium


Premium


Premium


Premium


Premium


Premium

Premium


Explore More Free Stock Images