- Home >
- Stock Photos >
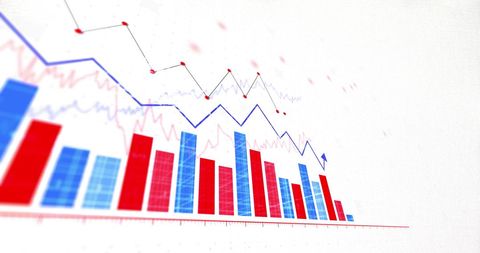
- 3D Bars and Line Graphs for Data Visualization on Dynamic Dashboard
3D Bars and Line Graphs for Data Visualization on Dynamic Dashboard Image

Engaging design featuring 3D bars and line graphs displaying quantitative data likely intended for business or statistical analysis. Usable for visuals in corporate presentations on data trends, reports on business intelligence, or educational material on data analytics.

downloads
Tags:
More
Credit Photo
If you would like to credit the Photo, here are some ways you can do so
Text Link
photo Link
<span class="text-link">
<span>
<a target="_blank" href=https://pikwizard.com/photo/3d-bars-and-line-graphs-for-data-visualization-on-dynamic-dashboard/c1428f8e643d04182d417702561a6f74/>PikWizard</a>
</span>
</span>
<span class="image-link">
<span
style="margin: 0 0 20px 0; display: inline-block; vertical-align: middle; width: 100%;"
>
<a
target="_blank"
href="https://pikwizard.com/photo/3d-bars-and-line-graphs-for-data-visualization-on-dynamic-dashboard/c1428f8e643d04182d417702561a6f74/"
style="text-decoration: none; font-size: 10px; margin: 0;"
>
<img src="https://pikwizard.com/pw/medium/c1428f8e643d04182d417702561a6f74.jpg" style="margin: 0; width: 100%;" alt="" />
<p style="font-size: 12px; margin: 0;">PikWizard</p>
</a>
</span>
</span>
Free (free of charge)
Free for personal and commercial use.
Author: People Creations