- Home >
- Stock Photos >
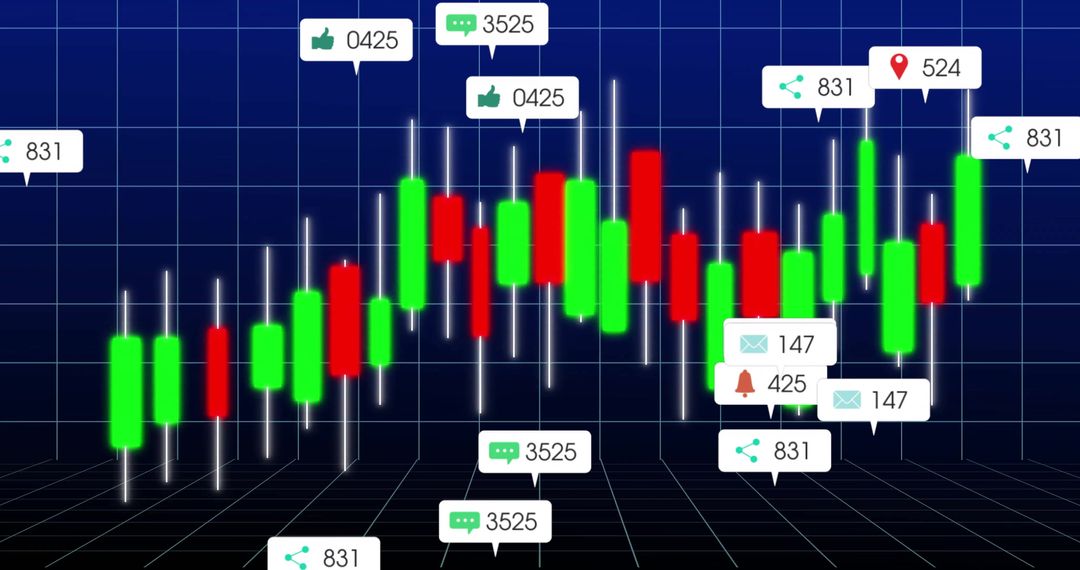
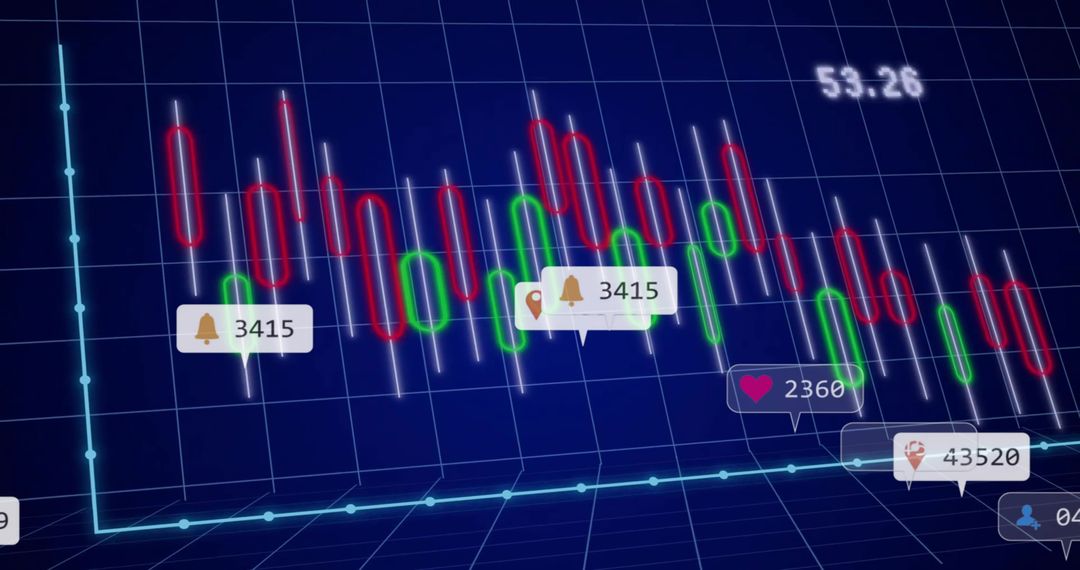
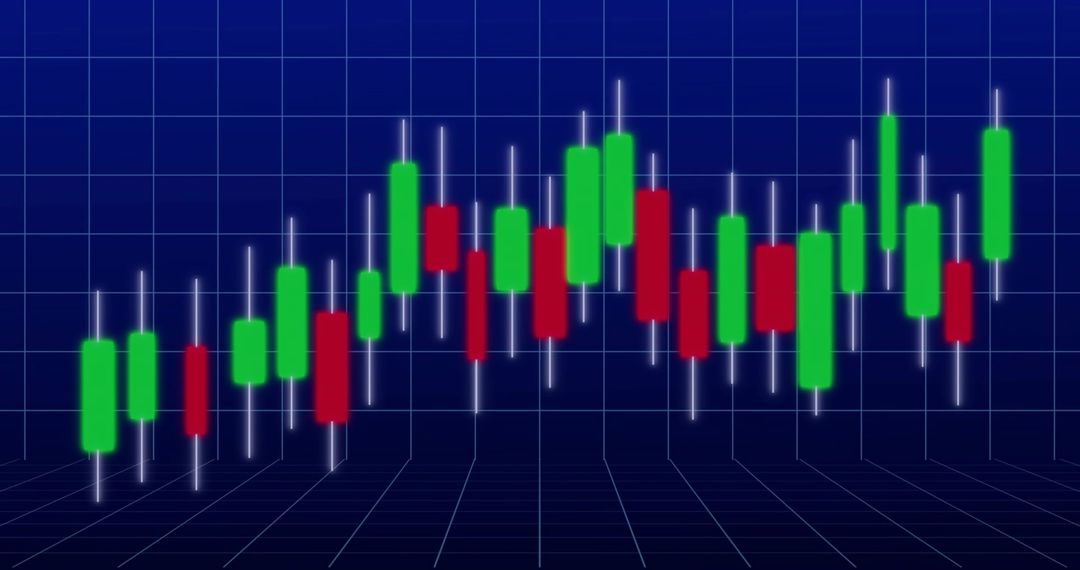
- 3D Candlestick Chart Illustration in Trading Interface
3D Candlestick Chart Illustration in Trading Interface Image
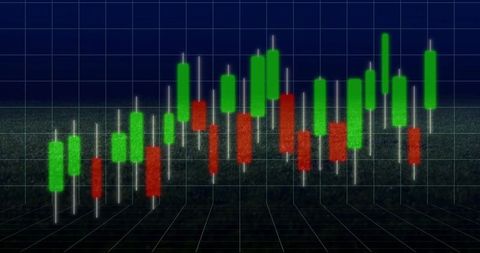
Vibrant illustration of 3D candlestick chart floating above floor grid, ideal for financial analysis content, trading app interfaces, financial services advertising, and educational resources on stock market trading. Useful in presentations about financial data visualization and investment strategies.
Powered by 


0
downloads
downloads
Tags:
More
Credit Photo
If you would like to credit the Photo, here are some ways you can do so
Text Link
photo Link
<span class="text-link">
<span>
<a target="_blank" href=https://pikwizard.com/photo/3d-candlestick-chart-illustration-in-trading-interface/60f14718056efd35b65cb1be4851d603/>PikWizard</a>
</span>
</span>
<span class="image-link">
<span
style="margin: 0 0 20px 0; display: inline-block; vertical-align: middle; width: 100%;"
>
<a
target="_blank"
href="https://pikwizard.com/photo/3d-candlestick-chart-illustration-in-trading-interface/60f14718056efd35b65cb1be4851d603/"
style="text-decoration: none; font-size: 10px; margin: 0;"
>
<img src="https://pikwizard.com/pw/medium/60f14718056efd35b65cb1be4851d603.jpg" style="margin: 0; width: 100%;" alt="" />
<p style="font-size: 12px; margin: 0;">PikWizard</p>
</a>
</span>
</span>
Free (free of charge)
Free for personal and commercial use.
Author: Awesome Content
Similar Free Stock Images

Premium


Premium


Premium


Premium


Premium


Premium


Premium


Premium


Premium


Premium


Premium


Premium


Premium


Premium


Premium


Premium


Premium


Premium


Premium


Premium


Premium


Premium


Premium


Premium