
- Home >
- Stock Photos >
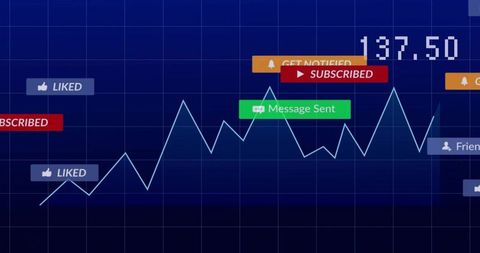
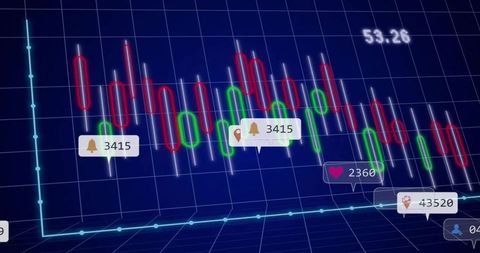
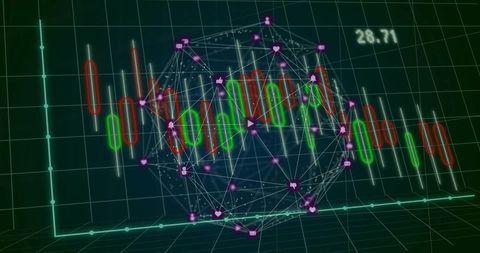
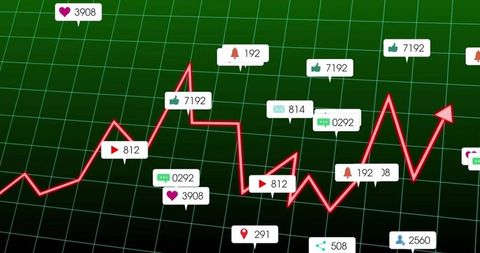
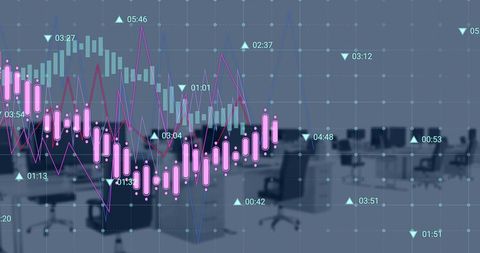
- 3D Candlestick Chart with Digital Notifications Overlay
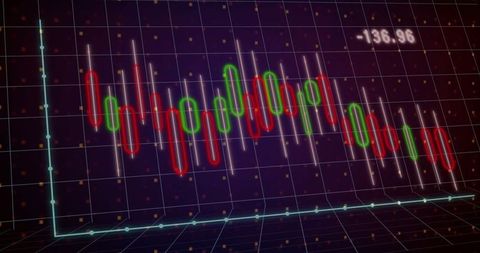
3D Candlestick Chart with Digital Notifications Overlay Image
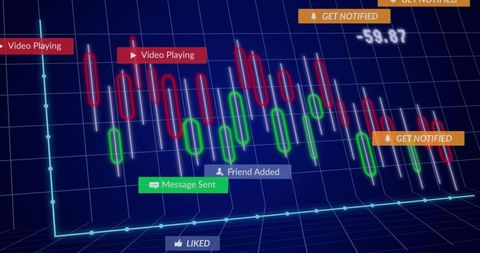
Dynamic visualization of a 3D candlestick chart with digital notifications embedded serves as a compelling tool for illustrating trade activity, financial analysis, or stock market simulations. Effective for presentations geared towards finance professionals or students of financial technology, provides an engaging way to present financial patterns or trends. Useful for educational tutorials or interactive digital designs.
Powered by  - Get 15% off with code: PIKWIZARD15


downloads
Tags:
More
Credit Photo
If you would like to credit the Photo, here are some ways you can do so
Text Link
photo Link
<span class="text-link">
<span>
<a target="_blank" href=https://pikwizard.com/photo/3d-candlestick-chart-with-digital-notifications-overlay/ffcf6a011dce34befa8e8a8ada6bd731/>PikWizard</a>
</span>
</span>
<span class="image-link">
<span
style="margin: 0 0 20px 0; display: inline-block; vertical-align: middle; width: 100%;"
>
<a
target="_blank"
href="https://pikwizard.com/photo/3d-candlestick-chart-with-digital-notifications-overlay/ffcf6a011dce34befa8e8a8ada6bd731/"
style="text-decoration: none; font-size: 10px; margin: 0;"
>
<img src="https://pikwizard.com/pw/medium/ffcf6a011dce34befa8e8a8ada6bd731.jpg" style="margin: 0; width: 100%;" alt="" />
<p style="font-size: 12px; margin: 0;">PikWizard</p>
</a>
</span>
</span>
Free (free of charge)
Free for personal and commercial use.
Author: People Creations
Similar Free Stock Images

Premium

Premium

Premium


Premium

Premium

Premium


Premium


Premium


Premium


Premium

Premium

Premium


Premium

Premium

Premium


Premium

Premium

Premium


Premium


Premium

Premium


Premium


Premium


Premium

Premium


Explore More Free Stock Images