- Home >
- Stock Photos >
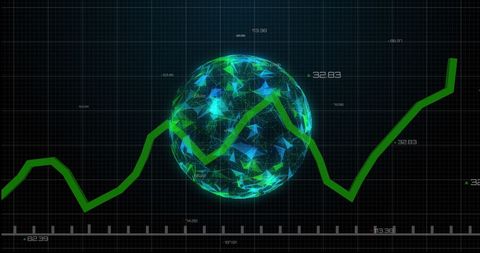
- 3D Data Trend Analysis with Global Grid Visualization
3D Data Trend Analysis with Global Grid Visualization Image

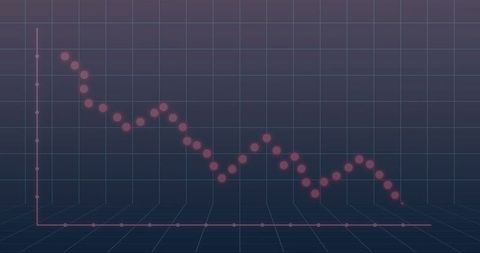
Effectively illustrating data trends with a digital approach,, it features a 3D digital display with a downward dotted line indicating negative financial performance, ideal for use in presentations, articles revolving around global market analysis, data interpretation studies, or technology exhibitions concerning innovation within analytics and its uses.

downloads
Tags:
More
Credit Photo
If you would like to credit the Photo, here are some ways you can do so
Text Link
photo Link
<span class="text-link">
<span>
<a target="_blank" href=https://pikwizard.com/photo/3d-data-trend-analysis-with-global-grid-visualization/59993e979baba61b4e9f590451f874f1/>PikWizard</a>
</span>
</span>
<span class="image-link">
<span
style="margin: 0 0 20px 0; display: inline-block; vertical-align: middle; width: 100%;"
>
<a
target="_blank"
href="https://pikwizard.com/photo/3d-data-trend-analysis-with-global-grid-visualization/59993e979baba61b4e9f590451f874f1/"
style="text-decoration: none; font-size: 10px; margin: 0;"
>
<img src="https://pikwizard.com/pw/medium/59993e979baba61b4e9f590451f874f1.jpg" style="margin: 0; width: 100%;" alt="" />
<p style="font-size: 12px; margin: 0;">PikWizard</p>
</a>
</span>
</span>
Free (free of charge)
Free for personal and commercial use.
Author: People Creations