
- Home >
- Stock Photos >
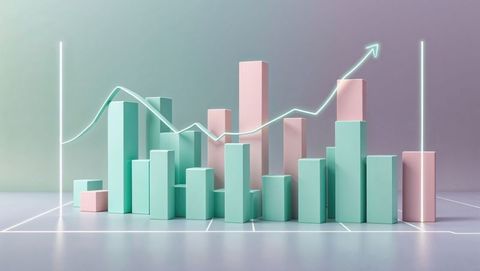
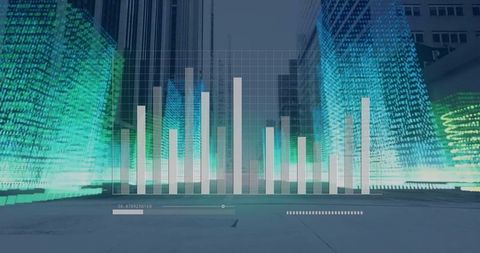
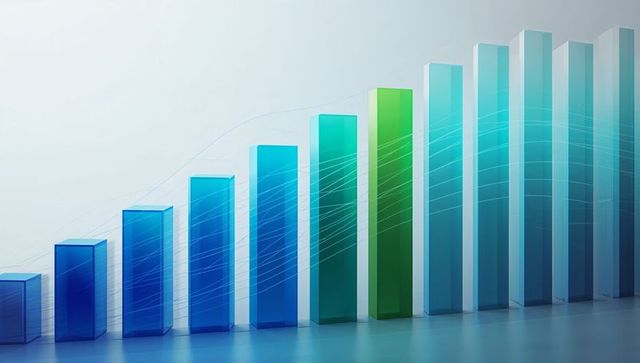
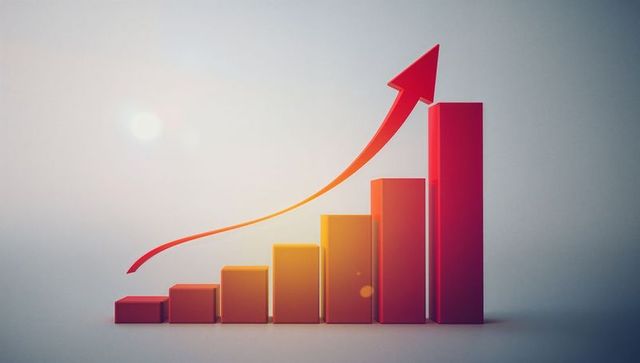
- 3D Data Visualization with Bar Graph and Glowing Trend Line
3D Data Visualization with Bar Graph and Glowing Trend Line Image
AI
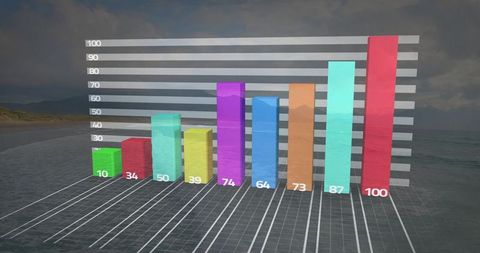
AI Generated Image. A modern data visualization featuring 3D mint green and pink bar graphs on a grid with a glowing line trend, showcasing trends and growth. Perfect for presentations, reports, and infographics to illustrate statistical analysis or financial growth in a tech-forward way. Can be used for themed articles on data science, tech innovations, and business forecasts.

downloads
Tags:
More
Credit Photo
If you would like to credit the Photo, here are some ways you can do so
Text Link
photo Link
<span class="text-link">
<span>
<a target="_blank" href=https://pikwizard.com/photo/3d-data-visualization-with-bar-graph-and-glowing-trend-line/acee601999152d9acf8e82cc8f0f207f/>PikWizard</a>
</span>
</span>
<span class="image-link">
<span
style="margin: 0 0 20px 0; display: inline-block; vertical-align: middle; width: 100%;"
>
<a
target="_blank"
href="https://pikwizard.com/photo/3d-data-visualization-with-bar-graph-and-glowing-trend-line/acee601999152d9acf8e82cc8f0f207f/"
style="text-decoration: none; font-size: 10px; margin: 0;"
>
<img src="https://pikwizard.com/pw/medium/acee601999152d9acf8e82cc8f0f207f.jpg" style="margin: 0; width: 100%;" alt="" />
<p style="font-size: 12px; margin: 0;">PikWizard</p>
</a>
</span>
</span>
Free (free of charge)
Free for personal and commercial use.
Author: AI Creator
Similar Free Stock Images

AI


AI

AI

AI

AI

AI

AI


AI


AI


AI

AI

AI

AI

AI


AI


AI


AI

AI

AI
AI

AI

AI


AI


AI

AI

AI

AI


AI

AI

AI

AI

AI

AI

AI


AI

AI

AI
AI


AI


AI
AI

AI


AI


AI

AI

AI

AI


AI

AI

AI

AI


AI


AI


AI


Explore More Free Stock Images