- Home >
- Stock Photos >
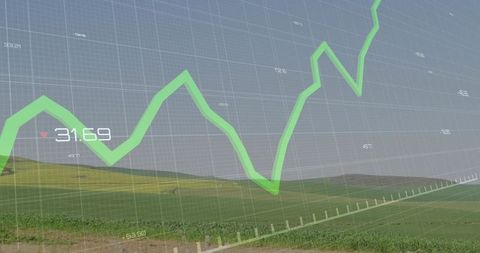
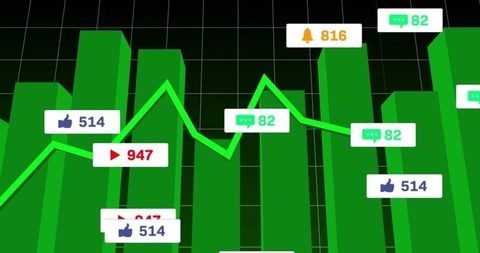
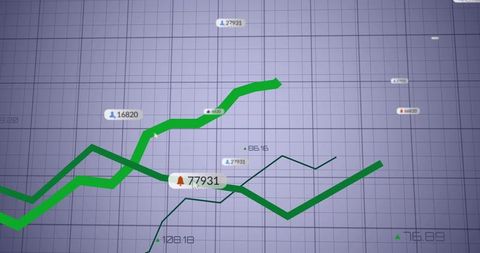
- 3D Data Visualization with Interactive Analytics Dashboard
3D Data Visualization with Interactive Analytics Dashboard Image

The image displays a dynamic 3D data visualization with floating labels and icons, perfect for conveying business analytics and performance insights. Ideal for use in presentations, this visualization can enhance a report or website showcasing digital analysis tools or services with its modern aesthetic.

downloads
Tags:
More
Credit Photo
If you would like to credit the Photo, here are some ways you can do so
Text Link
photo Link
<span class="text-link">
<span>
<a target="_blank" href=https://pikwizard.com/photo/3d-data-visualization-with-interactive-analytics-dashboard/03ab0f4c1ec1b77972888809041d2b90/>PikWizard</a>
</span>
</span>
<span class="image-link">
<span
style="margin: 0 0 20px 0; display: inline-block; vertical-align: middle; width: 100%;"
>
<a
target="_blank"
href="https://pikwizard.com/photo/3d-data-visualization-with-interactive-analytics-dashboard/03ab0f4c1ec1b77972888809041d2b90/"
style="text-decoration: none; font-size: 10px; margin: 0;"
>
<img src="https://pikwizard.com/pw/medium/03ab0f4c1ec1b77972888809041d2b90.jpg" style="margin: 0; width: 100%;" alt="" />
<p style="font-size: 12px; margin: 0;">PikWizard</p>
</a>
</span>
</span>
Free (free of charge)
Free for personal and commercial use.
Author: People Creations