
- Home >
- Stock Photos >
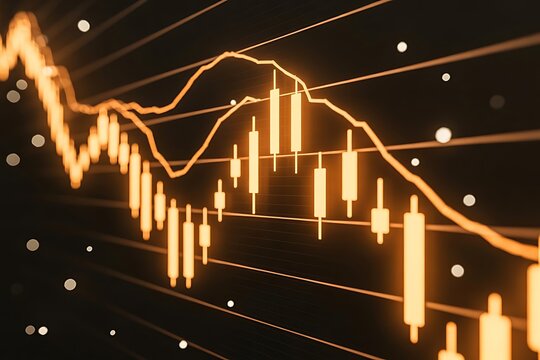
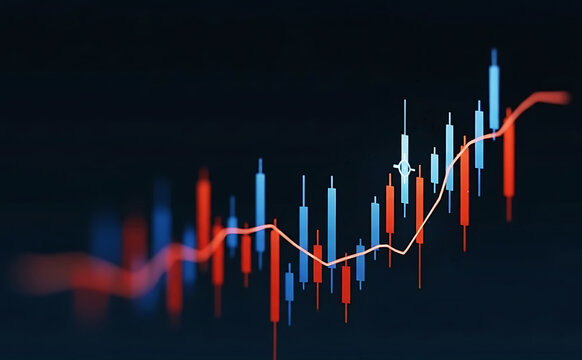
- 3D Digital Candlestick Chart with Financial Analysis Concept
3D Digital Candlestick Chart with Financial Analysis Concept Image
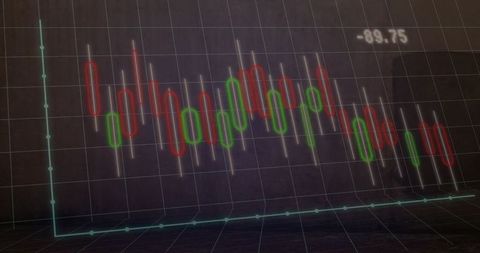
Image reveals 3D digital candlestick chart in dark virtual space, presenting vital analytics with green and red indicators. Perfect for illustrating complex financial concepts, accompanying blog articles co-related with stock market analysis, asset valuations, or fintech discussions. Use in presentations for discussing economic forecasts or investment dynamics.
Powered by 


0
downloads
downloads
Tags:
More
Credit Photo
If you would like to credit the Photo, here are some ways you can do so
Text Link
photo Link
<span class="text-link">
<span>
<a target="_blank" href=https://pikwizard.com/photo/3d-digital-candlestick-chart-with-financial-analysis-concept/57a4c563b32ae295500ce071980b1080/>PikWizard</a>
</span>
</span>
<span class="image-link">
<span
style="margin: 0 0 20px 0; display: inline-block; vertical-align: middle; width: 100%;"
>
<a
target="_blank"
href="https://pikwizard.com/photo/3d-digital-candlestick-chart-with-financial-analysis-concept/57a4c563b32ae295500ce071980b1080/"
style="text-decoration: none; font-size: 10px; margin: 0;"
>
<img src="https://pikwizard.com/pw/medium/57a4c563b32ae295500ce071980b1080.jpg" style="margin: 0; width: 100%;" alt="" />
<p style="font-size: 12px; margin: 0;">PikWizard</p>
</a>
</span>
</span>
Free (free of charge)
Free for personal and commercial use.
Author: People Creations