- Home >
- Stock Photos >
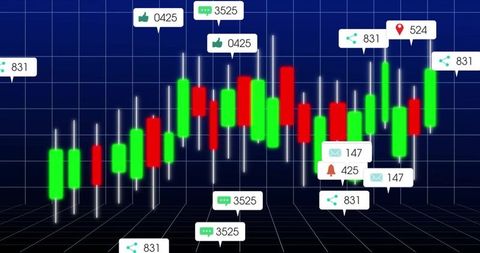
- 3D Digital Visualization of Candlestick Chart with Abstract Wave Pattern
3D Digital Visualization of Candlestick Chart with Abstract Wave Pattern Image

3D depiction of green and red candlesticks prominently displayed above a digital grid. The surrounding white dotted wave pattern adds a level of complexity and modern design. This visual reflects financial markets, suited for use in presentations about digital trading platforms or investment strategies. Ideal for business analytics, illustrating concepts in financial analysis, or highlighting market trends in financial software development materials.

downloads
Tags:
More
Credit Photo
If you would like to credit the Photo, here are some ways you can do so
Text Link
photo Link
<span class="text-link">
<span>
<a target="_blank" href=https://pikwizard.com/photo/3d-digital-visualization-of-candlestick-chart-with-abstract-wave-pattern/de2c34ecfd318a28785e5c0ab8f7a8aa/>PikWizard</a>
</span>
</span>
<span class="image-link">
<span
style="margin: 0 0 20px 0; display: inline-block; vertical-align: middle; width: 100%;"
>
<a
target="_blank"
href="https://pikwizard.com/photo/3d-digital-visualization-of-candlestick-chart-with-abstract-wave-pattern/de2c34ecfd318a28785e5c0ab8f7a8aa/"
style="text-decoration: none; font-size: 10px; margin: 0;"
>
<img src="https://pikwizard.com/pw/medium/de2c34ecfd318a28785e5c0ab8f7a8aa.jpg" style="margin: 0; width: 100%;" alt="" />
<p style="font-size: 12px; margin: 0;">PikWizard</p>
</a>
</span>
</span>
Free (free of charge)
Free for personal and commercial use.
Author: Authentic Images