- Home >
- Stock Photos >
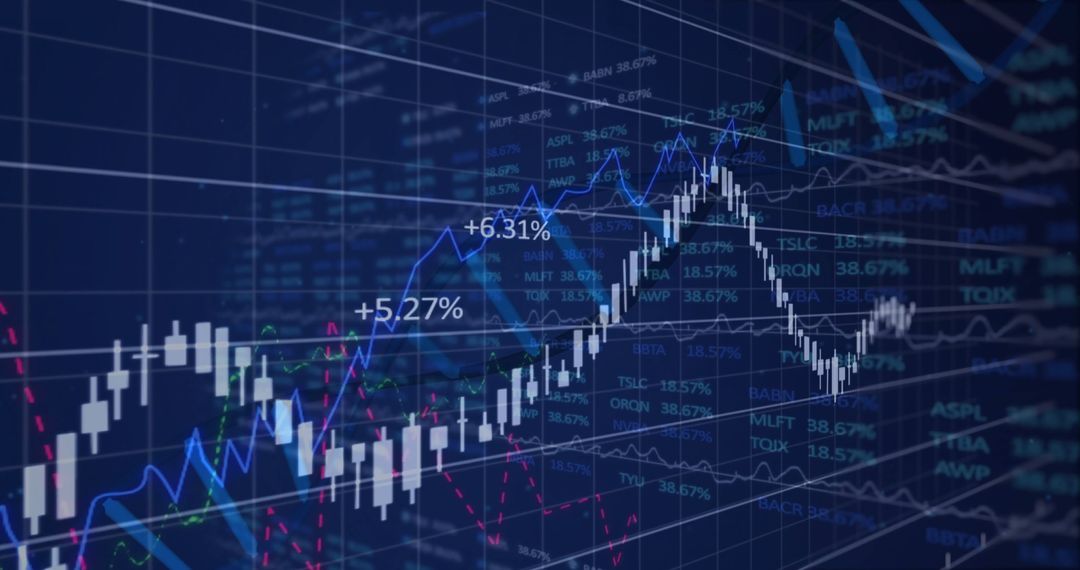
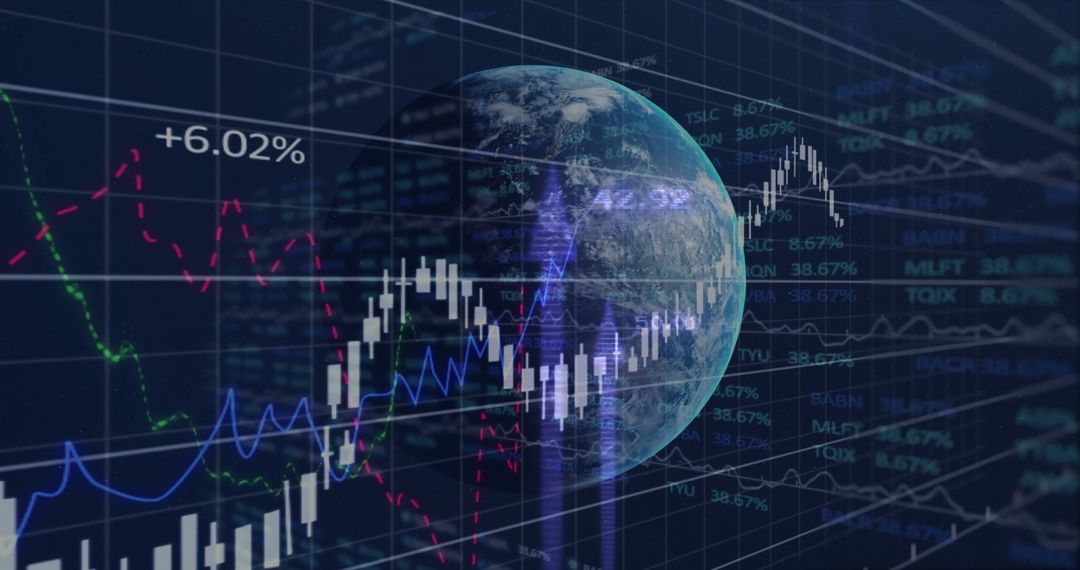
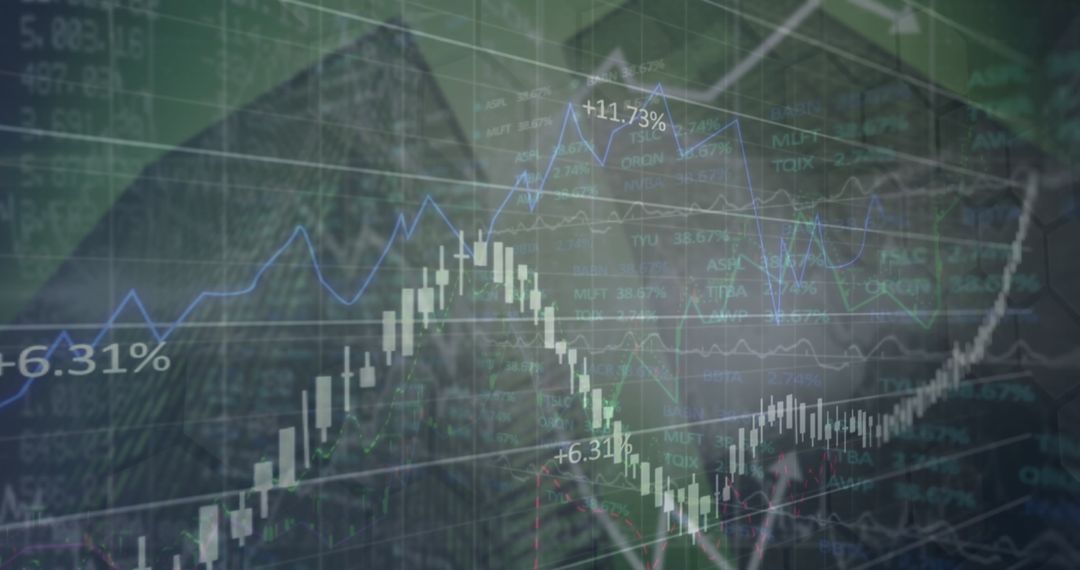
- 3D Financial Chart with Candlestick Bars and Trend Lines
3D Financial Chart with Candlestick Bars and Trend Lines Image

This image showcases a 3D financial chart detailing candlestick bars and line graphs with percentage labels exceeding six percent, symbolizing analytical insights and market trends. Featuring a futuristic digital platform aesthetic, the design emphasizes technological innovation and data analysis for financial trading or investment strategy. Suitable for finance-related content, illustrating market analysis, investment potential, trend tracking, and reports focused on economic growth or digital transformation.
Powered by  - Get 15% off with code: PIKWIZARD15


0
downloads
downloads
Tags:
More
Credit Photo
If you would like to credit the Photo, here are some ways you can do so
Text Link
photo Link
<span class="text-link">
<span>
<a target="_blank" href=https://pikwizard.com/photo/3d-financial-chart-with-candlestick-bars-and-trend-lines/044c5af11fe30161f441aa6ac5707eb8/>PikWizard</a>
</span>
</span>
<span class="image-link">
<span
style="margin: 0 0 20px 0; display: inline-block; vertical-align: middle; width: 100%;"
>
<a
target="_blank"
href="https://pikwizard.com/photo/3d-financial-chart-with-candlestick-bars-and-trend-lines/044c5af11fe30161f441aa6ac5707eb8/"
style="text-decoration: none; font-size: 10px; margin: 0;"
>
<img src="https://pikwizard.com/pw/medium/044c5af11fe30161f441aa6ac5707eb8.jpg" style="margin: 0; width: 100%;" alt="" />
<p style="font-size: 12px; margin: 0;">PikWizard</p>
</a>
</span>
</span>
Free (free of charge)
Free for personal and commercial use.
Author: Creative Art
Similar Free Stock Images

Premium


Premium


Premium


Premium


Premium


Premium


Premium


Premium


Premium


Premium


Premium


Premium


Premium


Premium


Premium


Premium


Premium


Premium


Premium


Premium


Premium


Premium


Premium


Premium