- Home >
- Stock Photos >
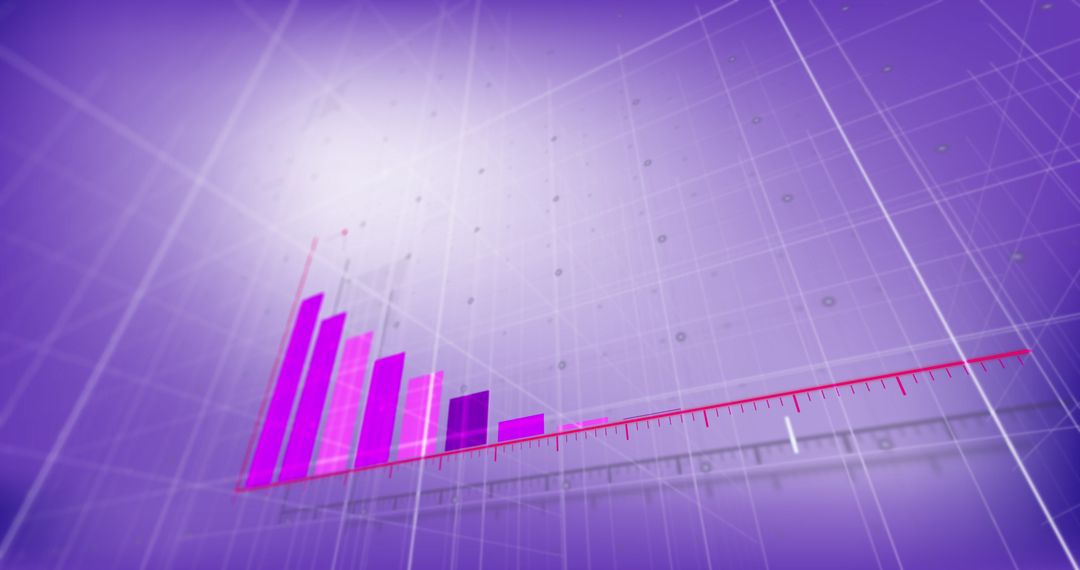
- 3D Financial Data Chart on Futuristic Purple Background
3D Financial Data Chart on Futuristic Purple Background Image

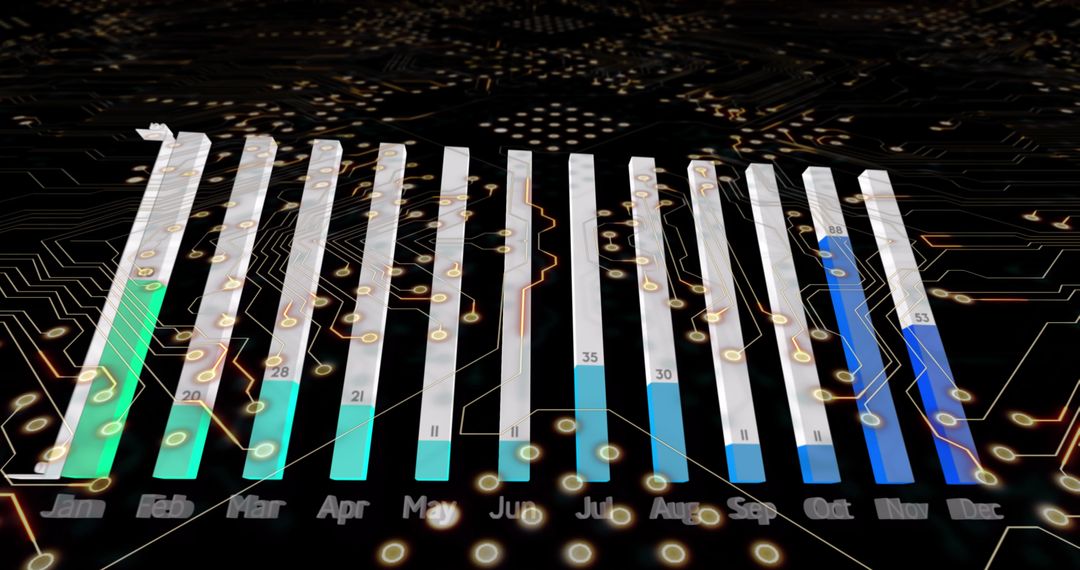
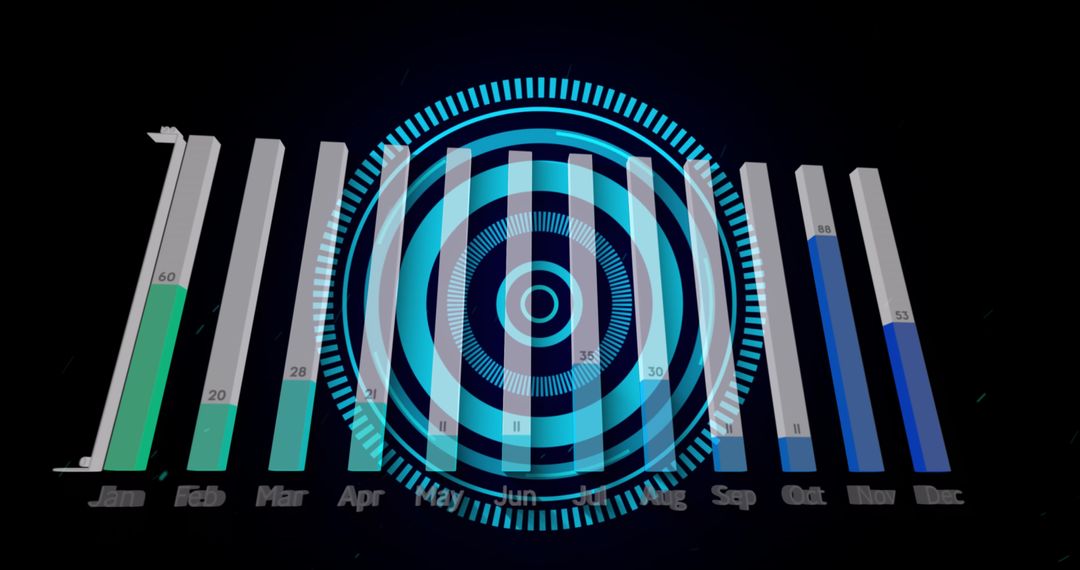
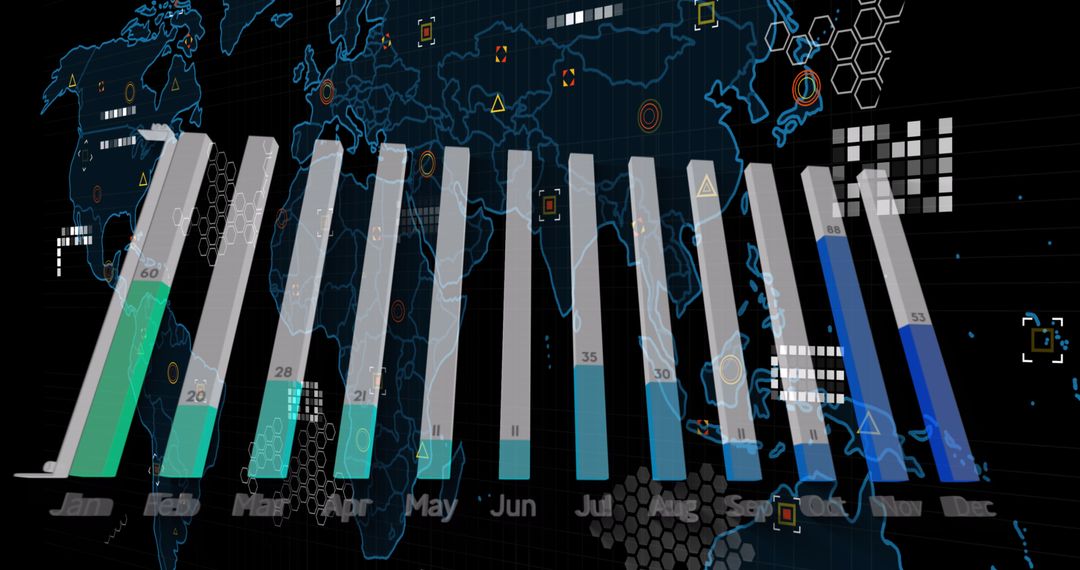
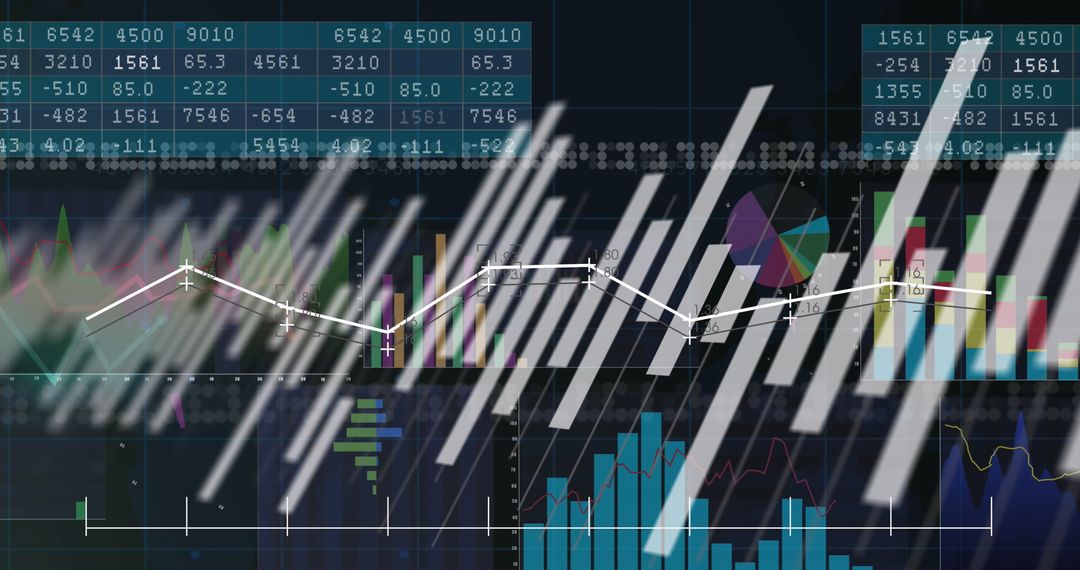
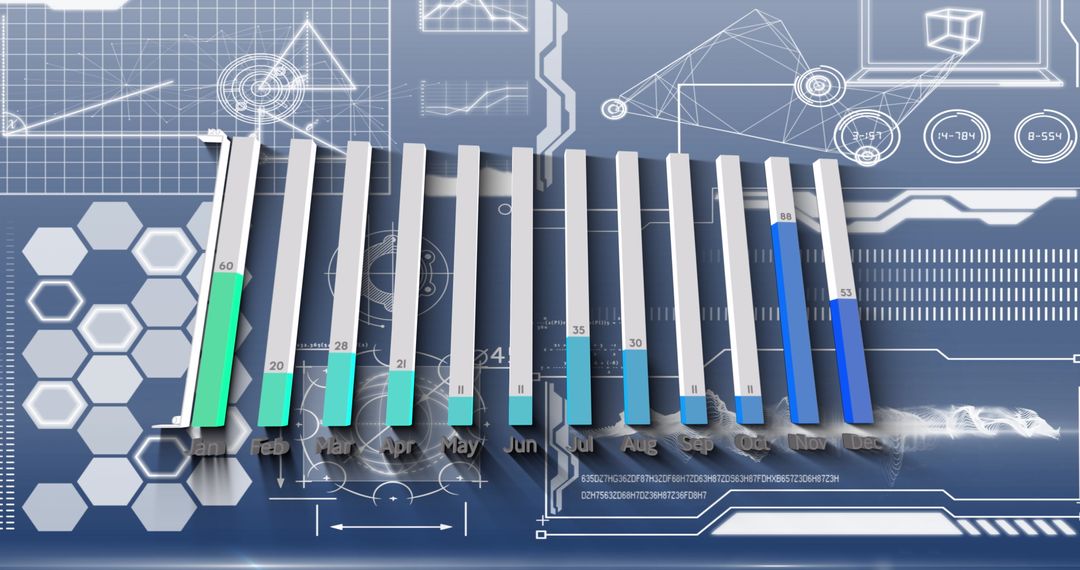
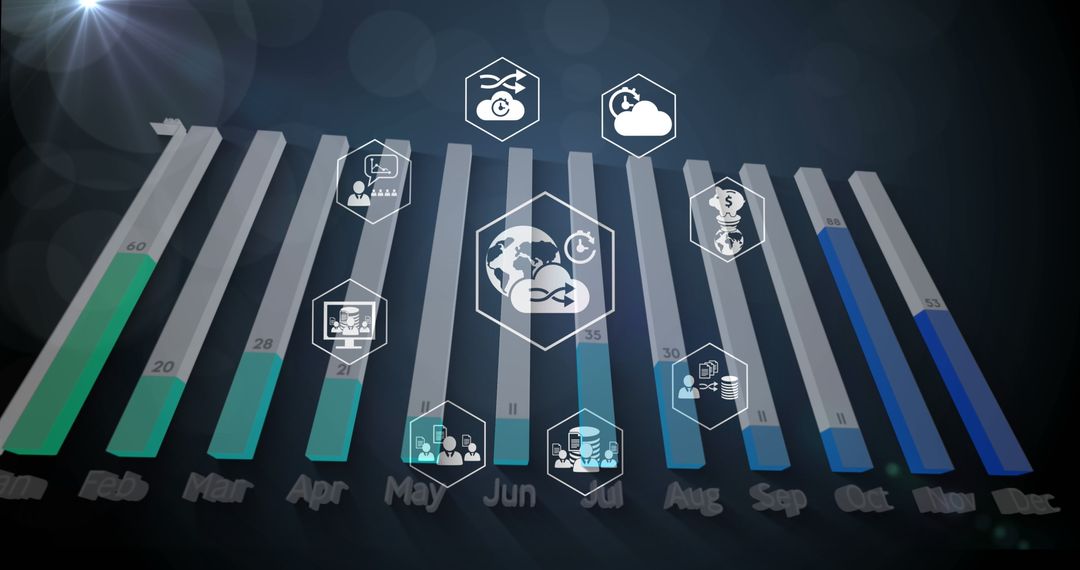
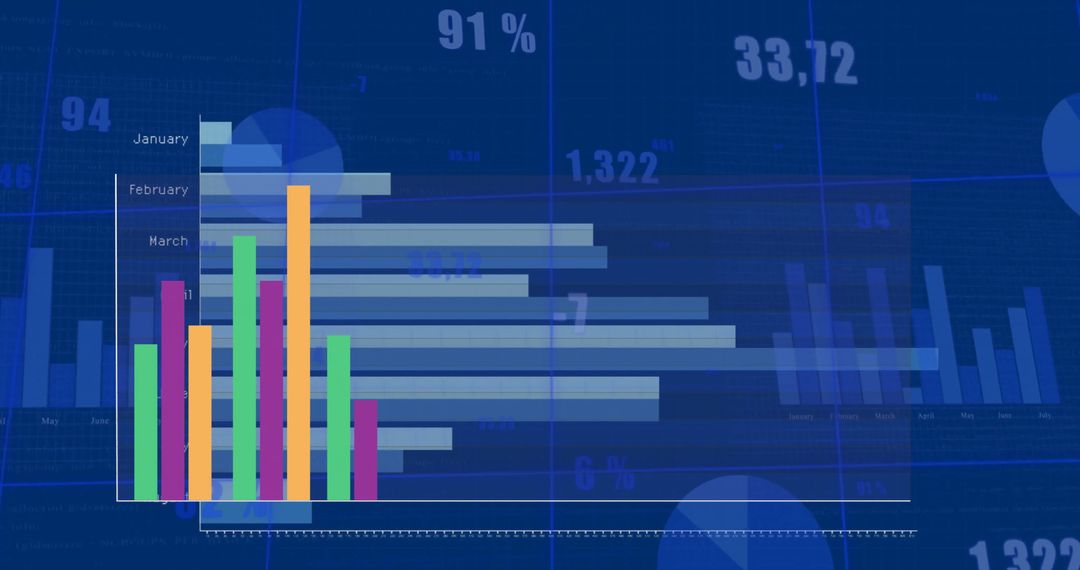
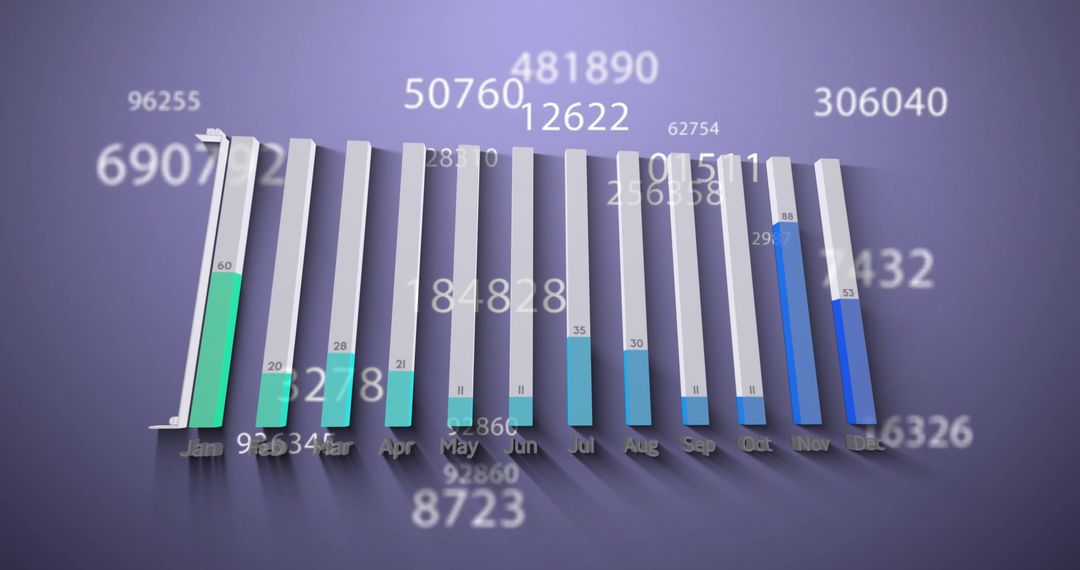
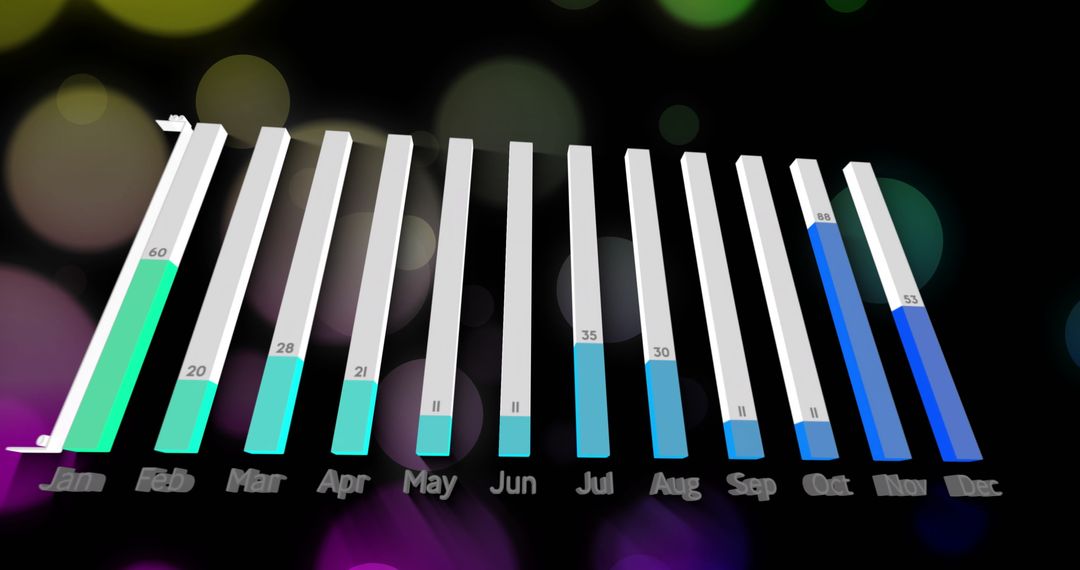
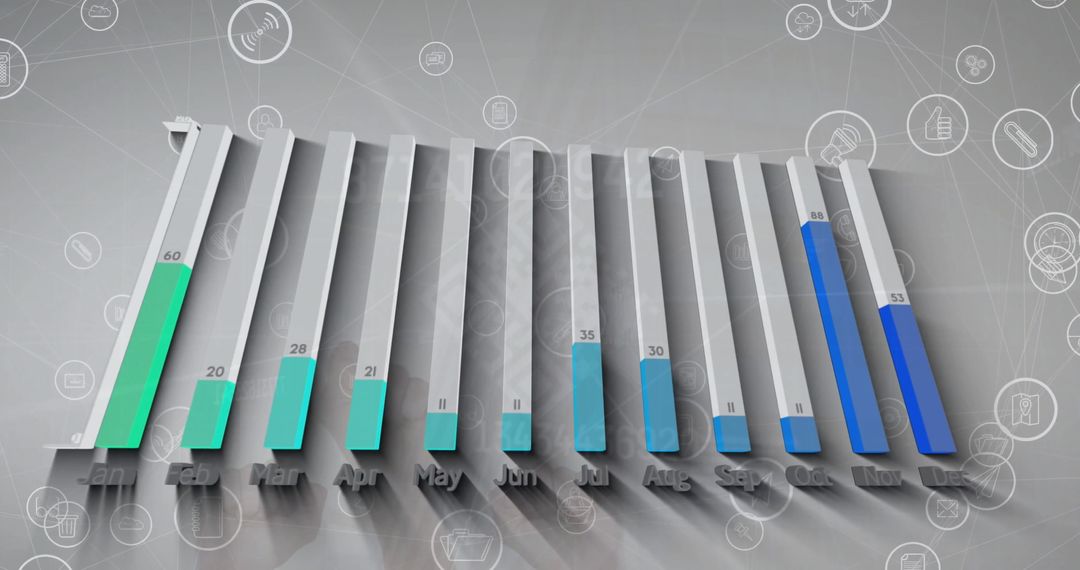
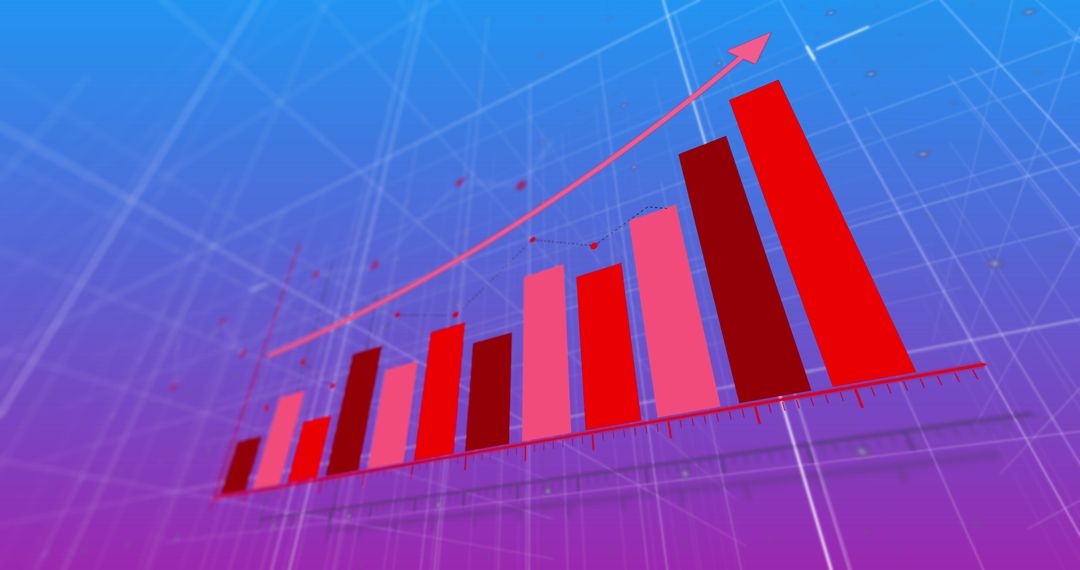
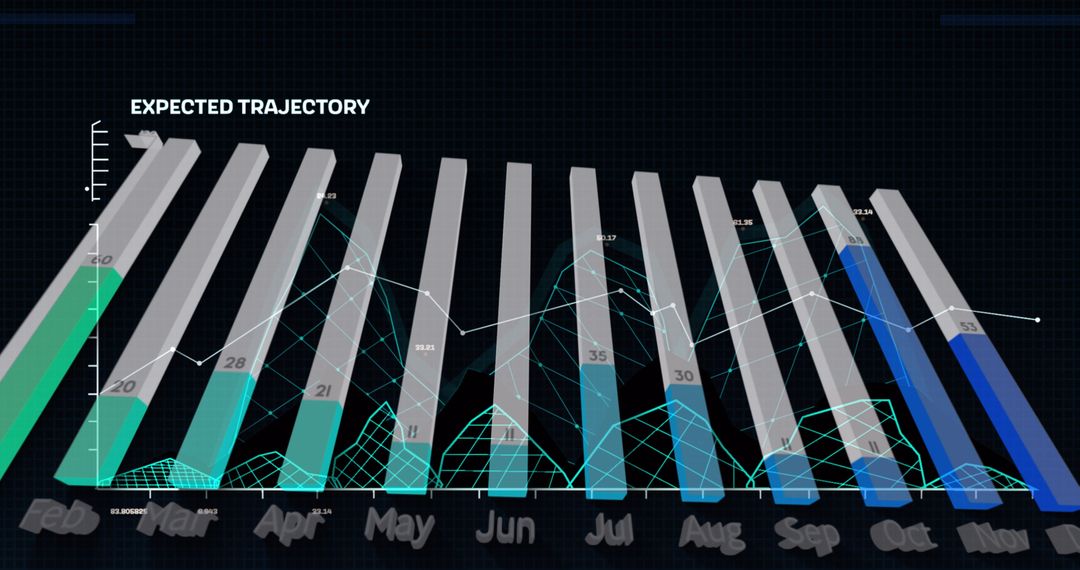
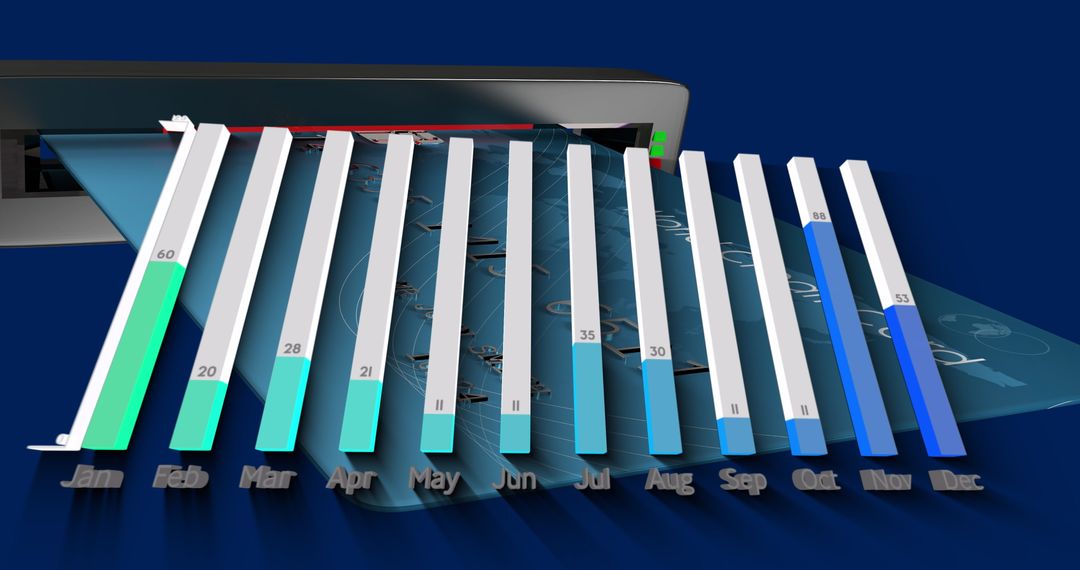
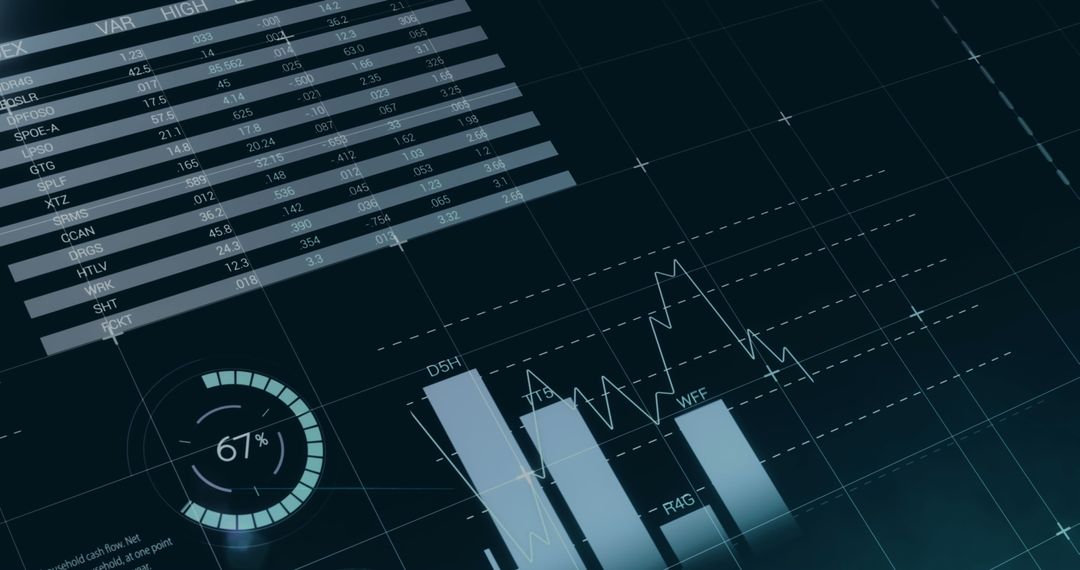
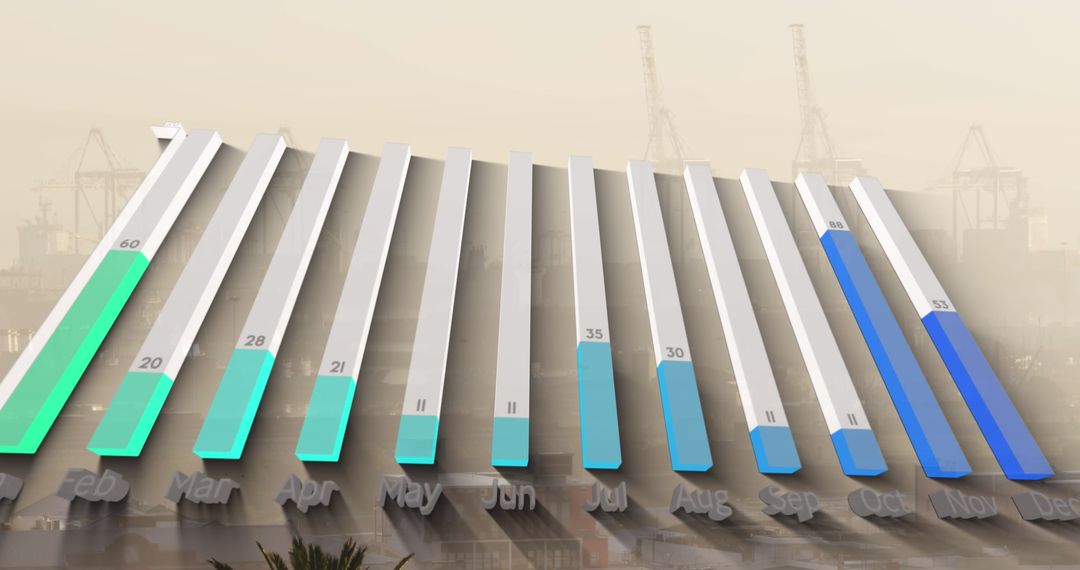
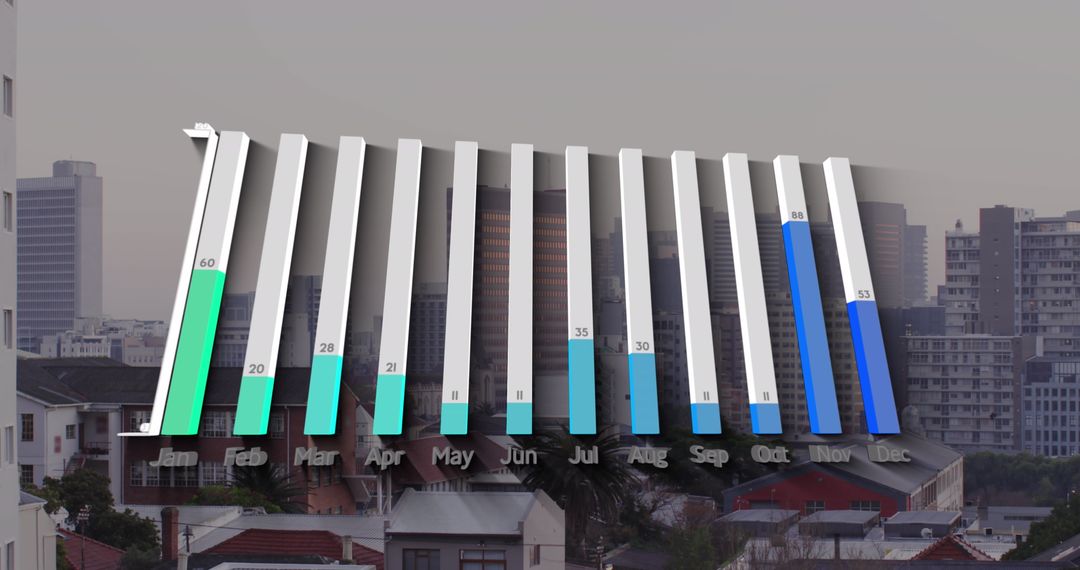
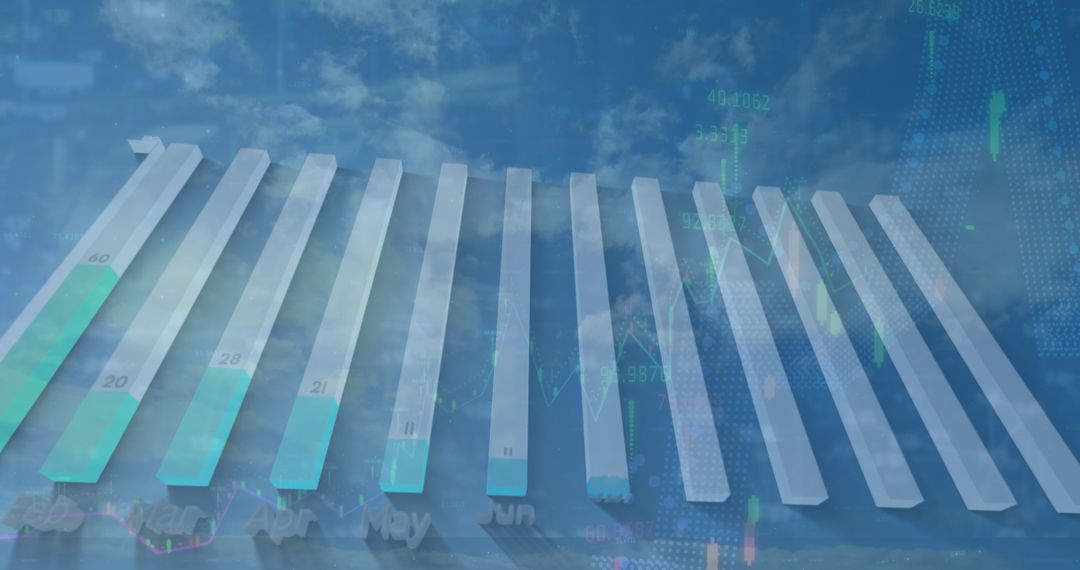
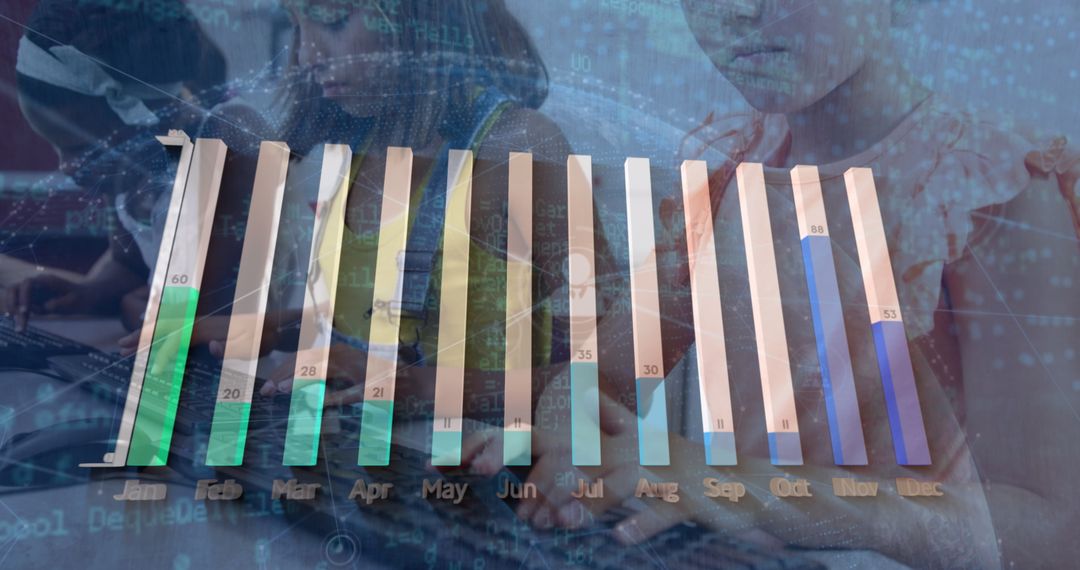
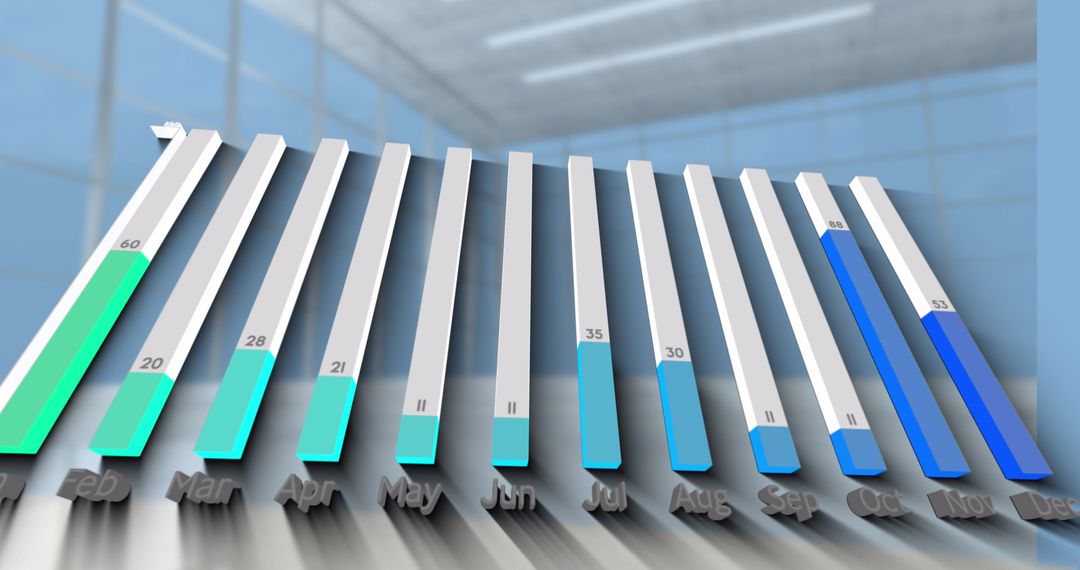
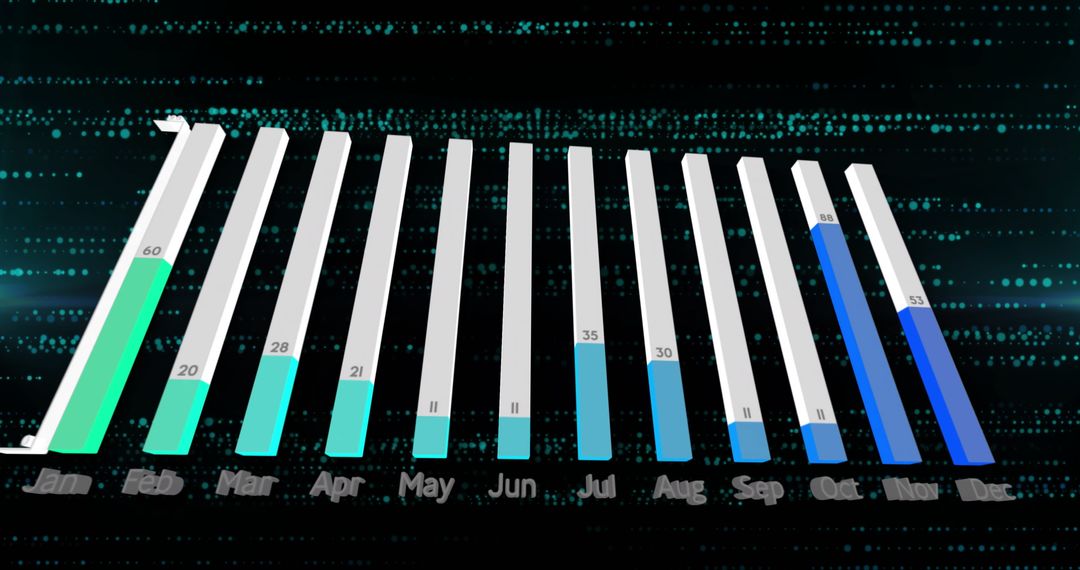
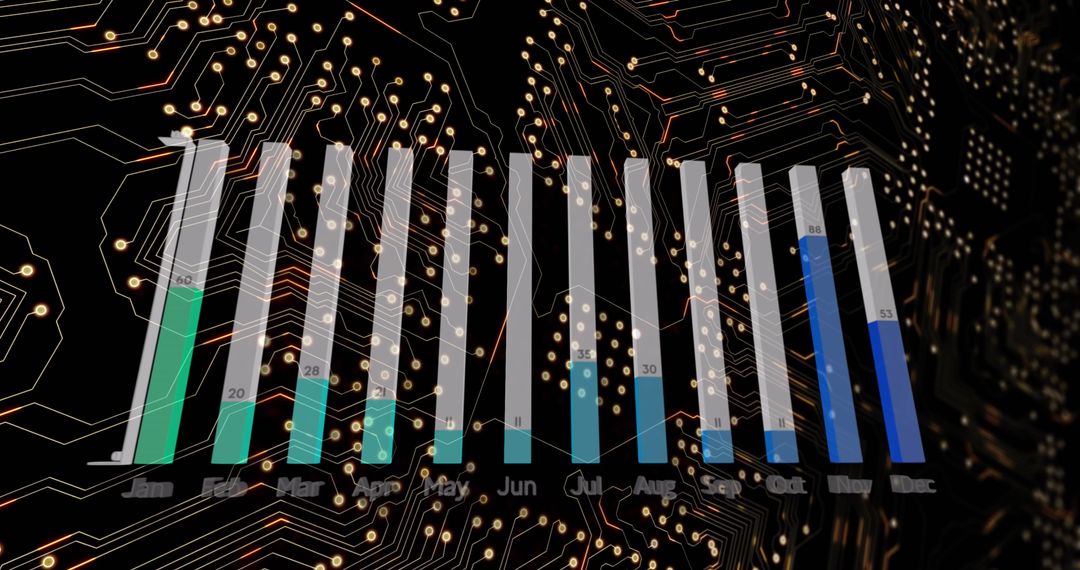
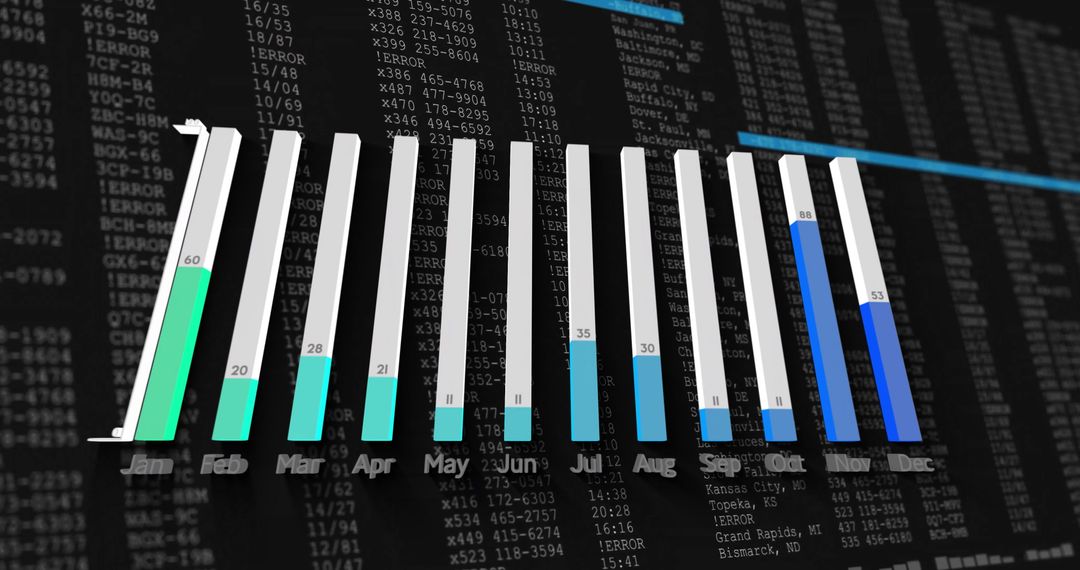
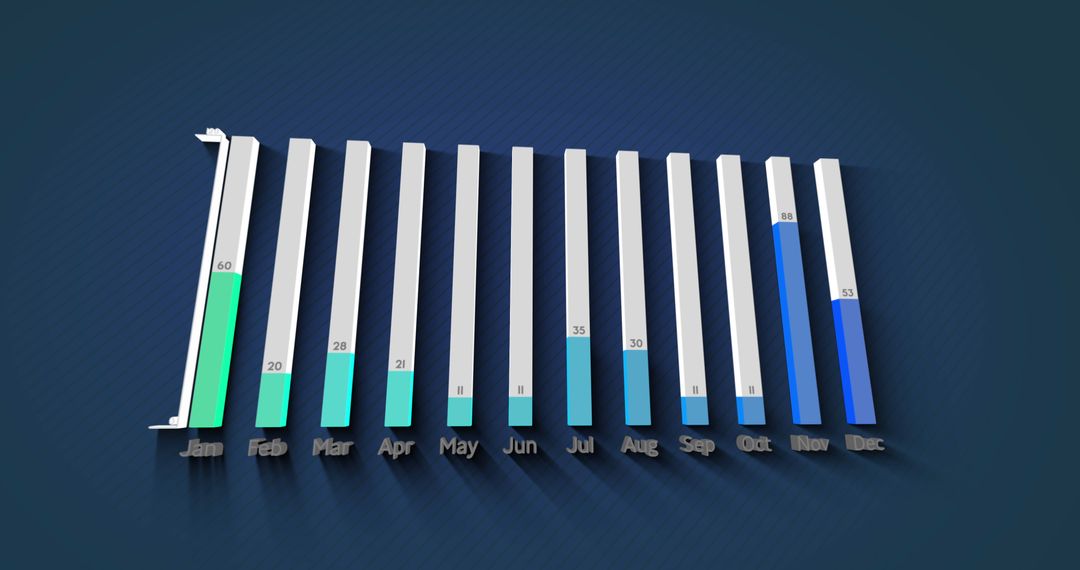
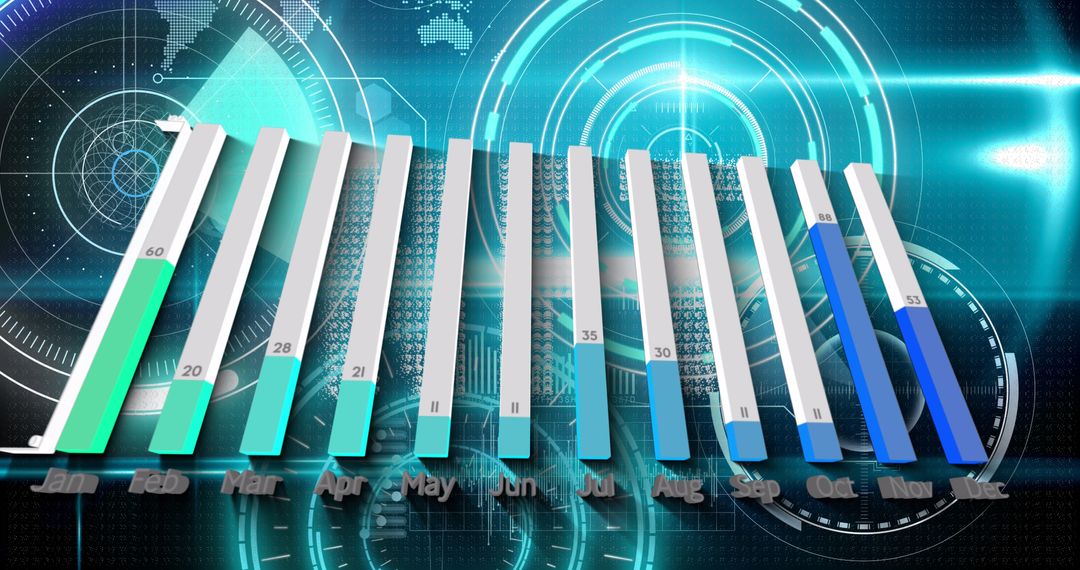
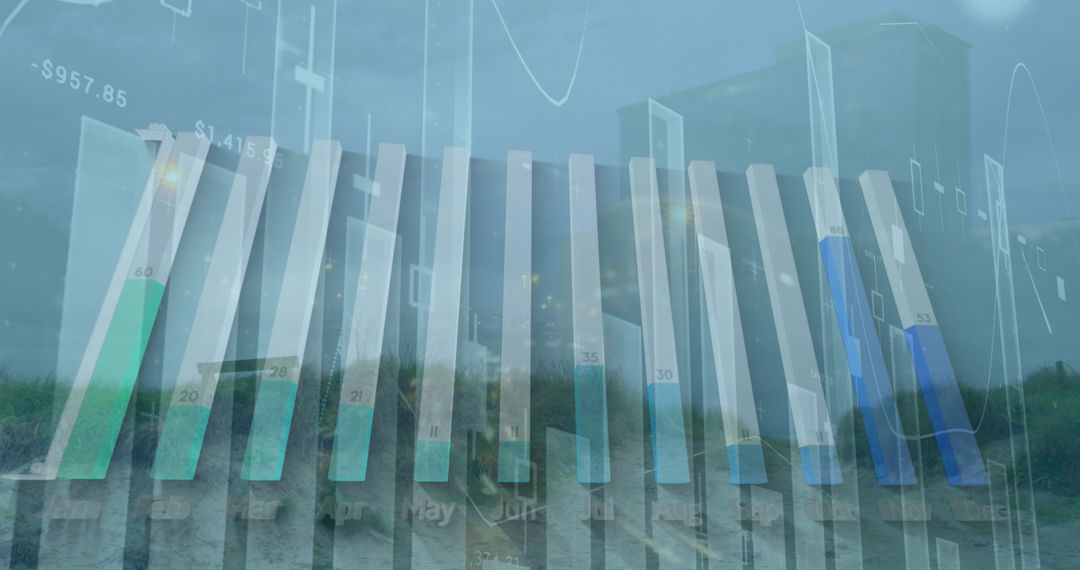
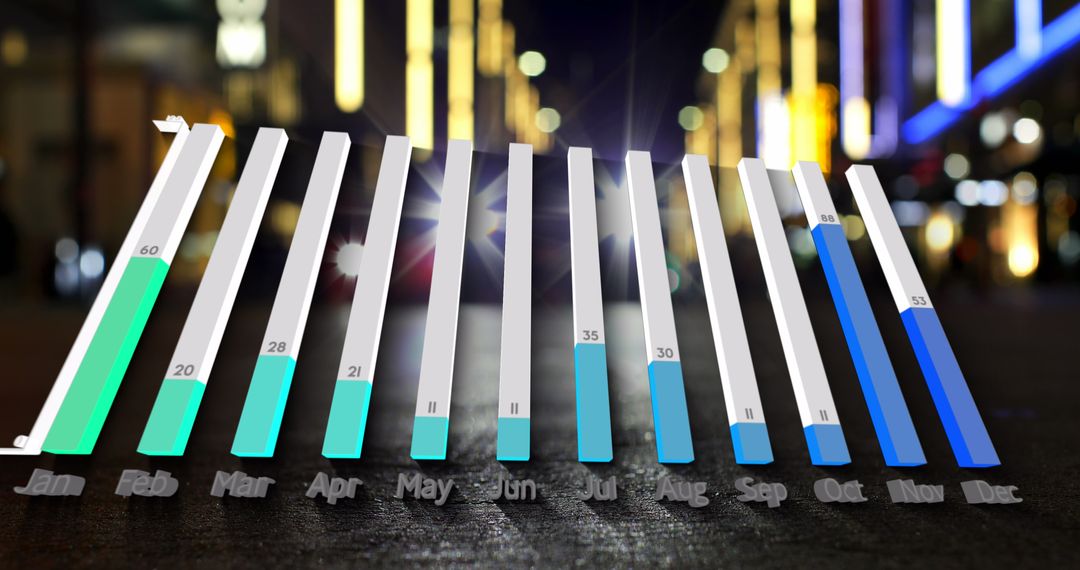
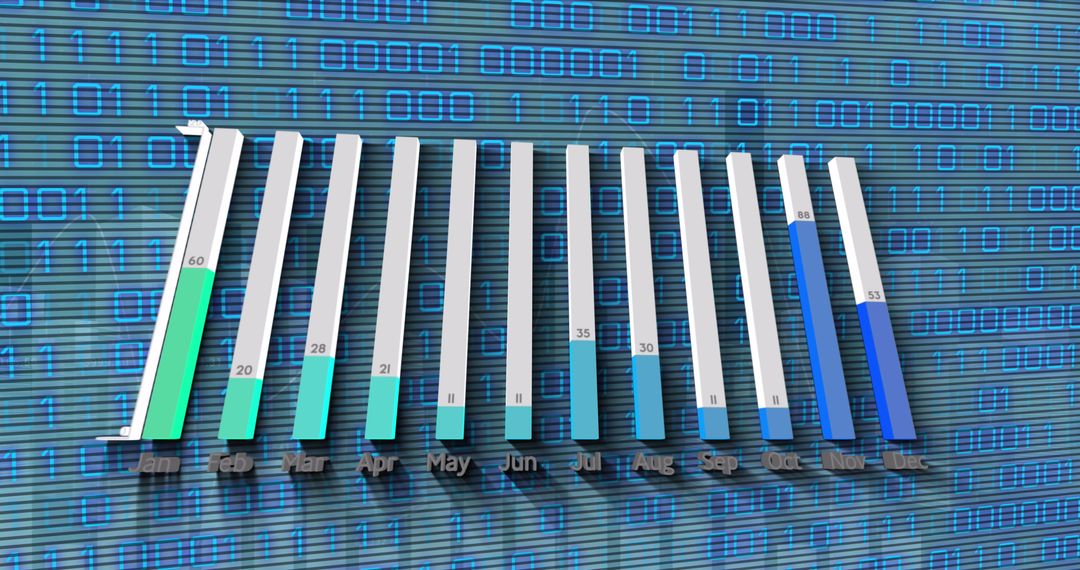
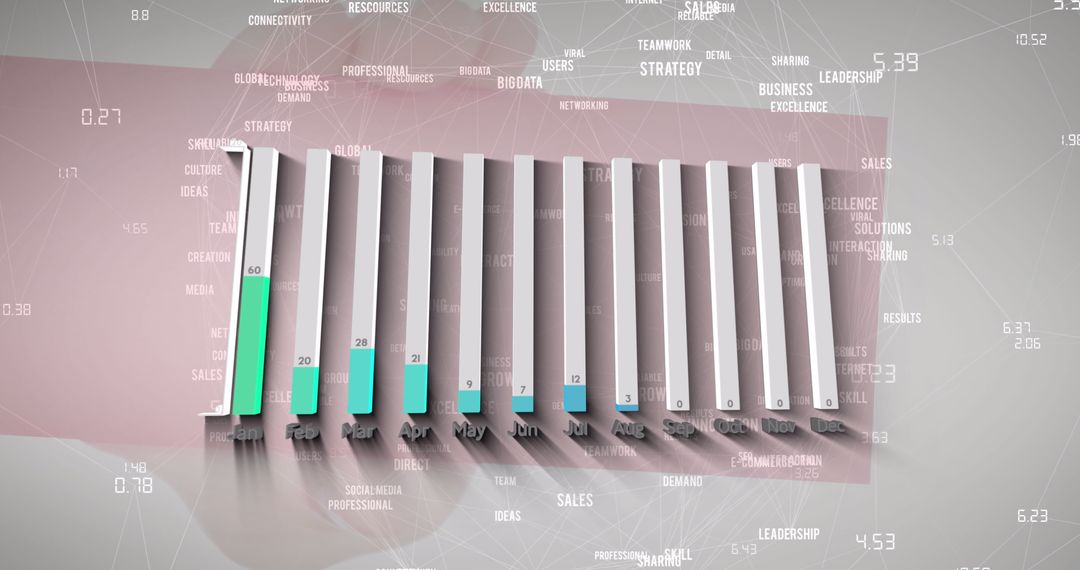
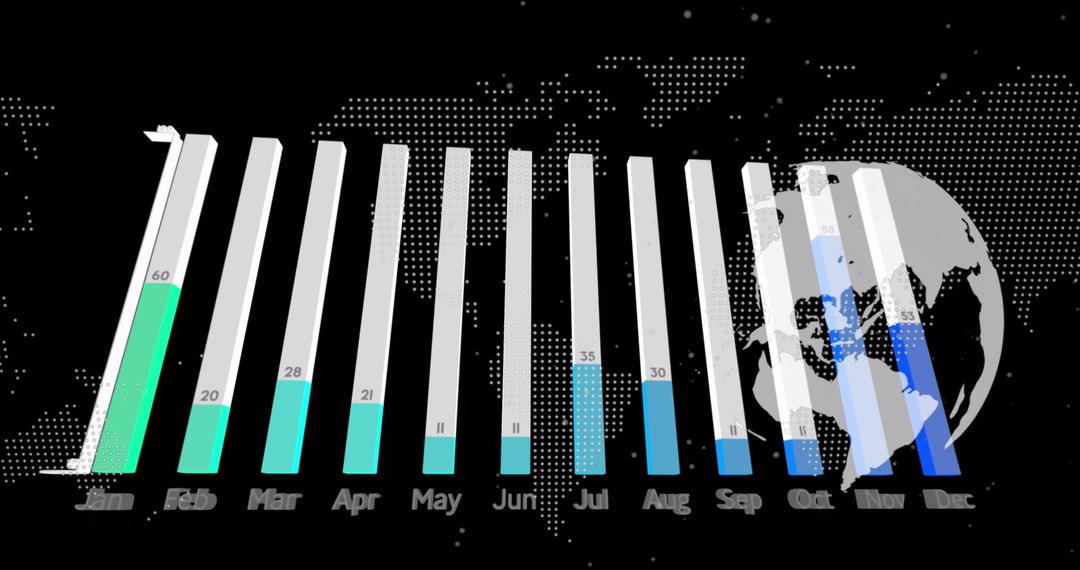
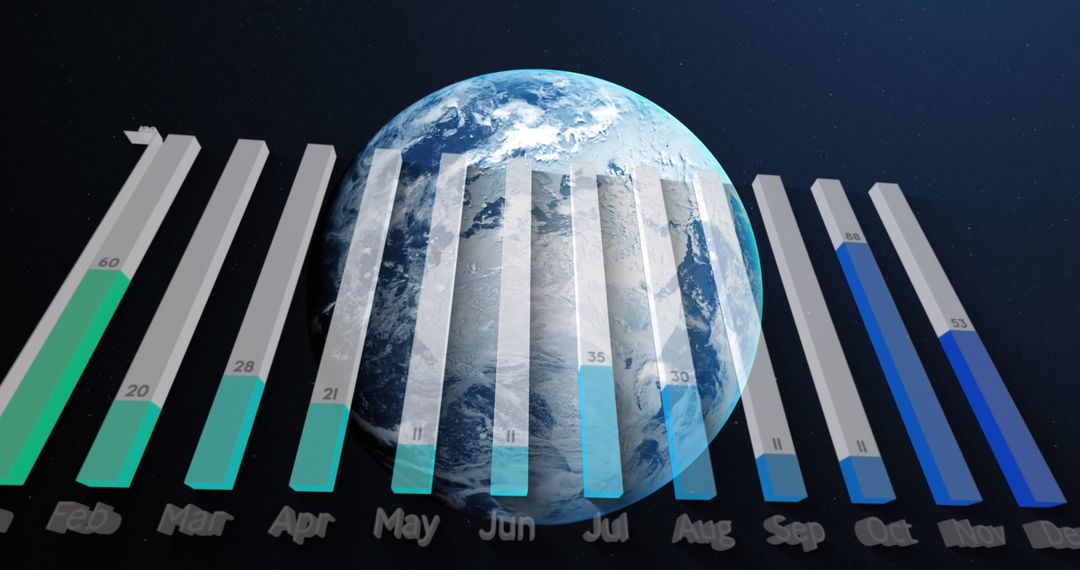
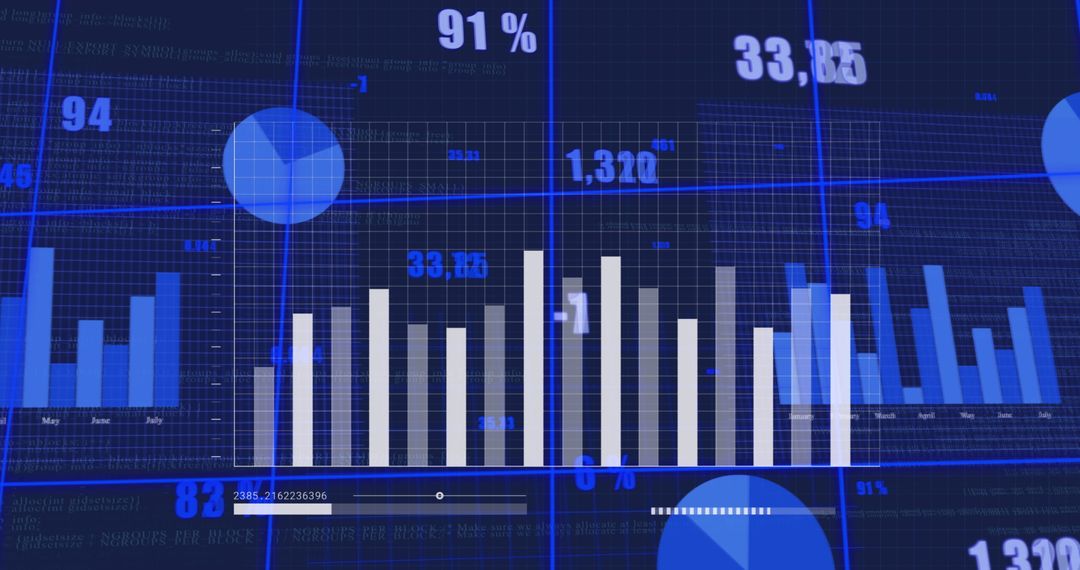
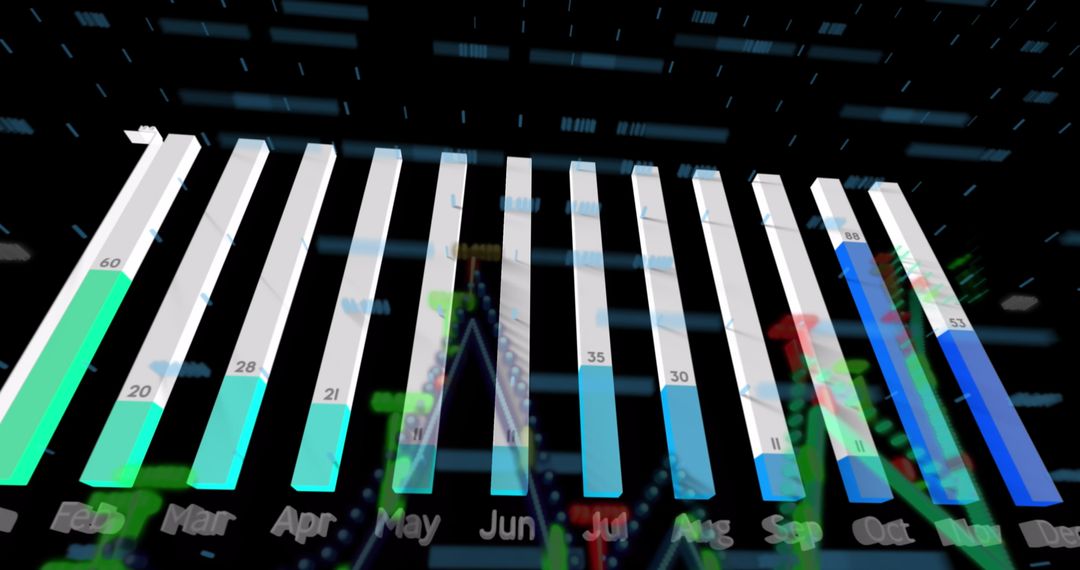
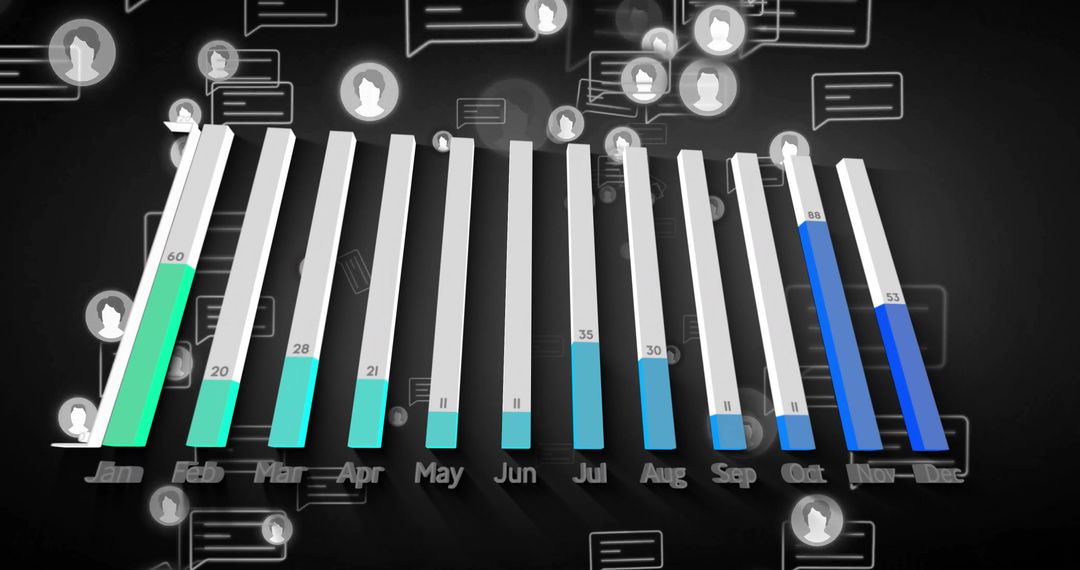
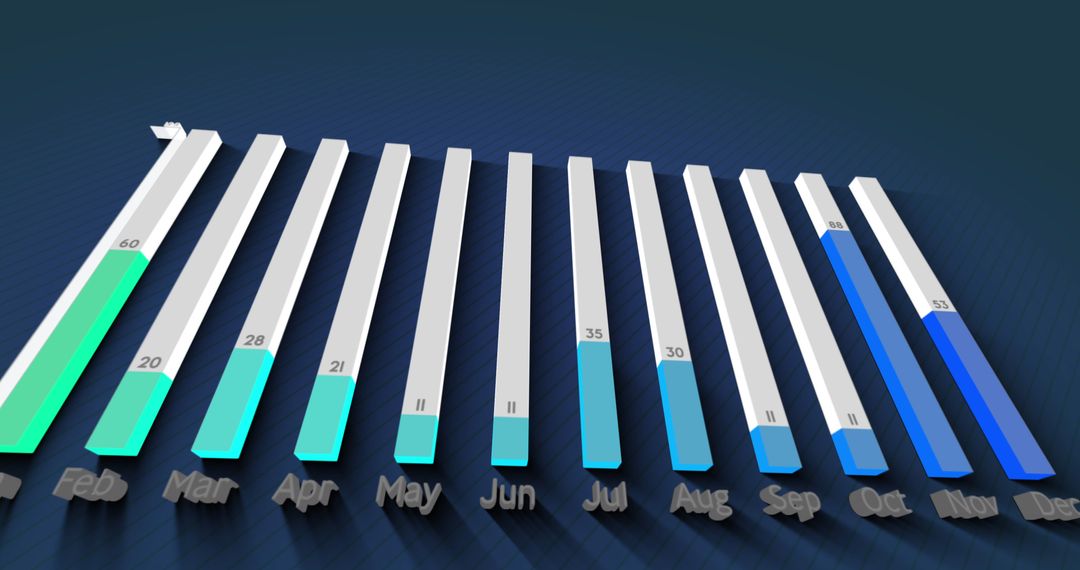
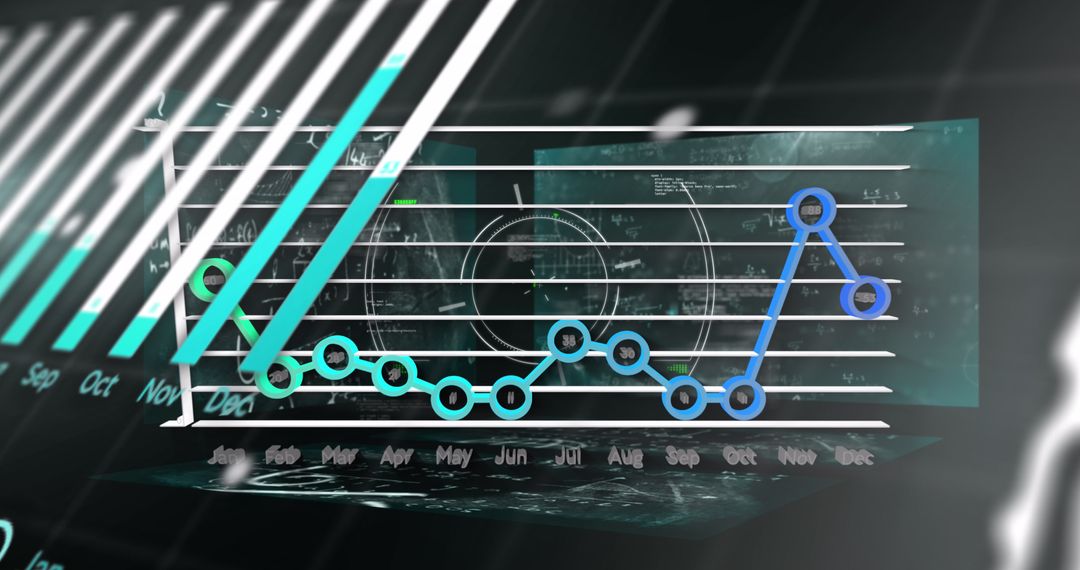
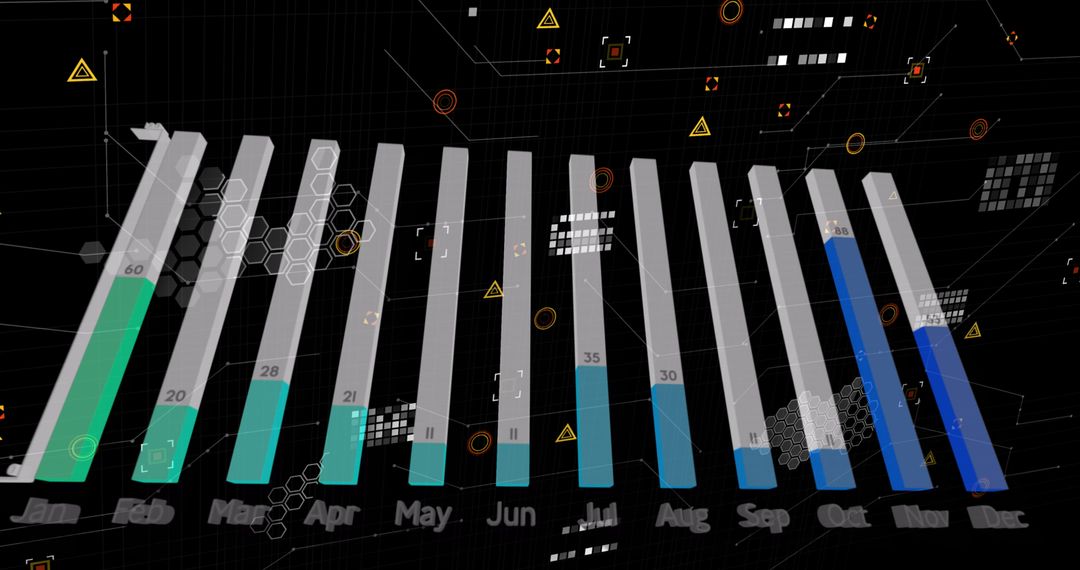
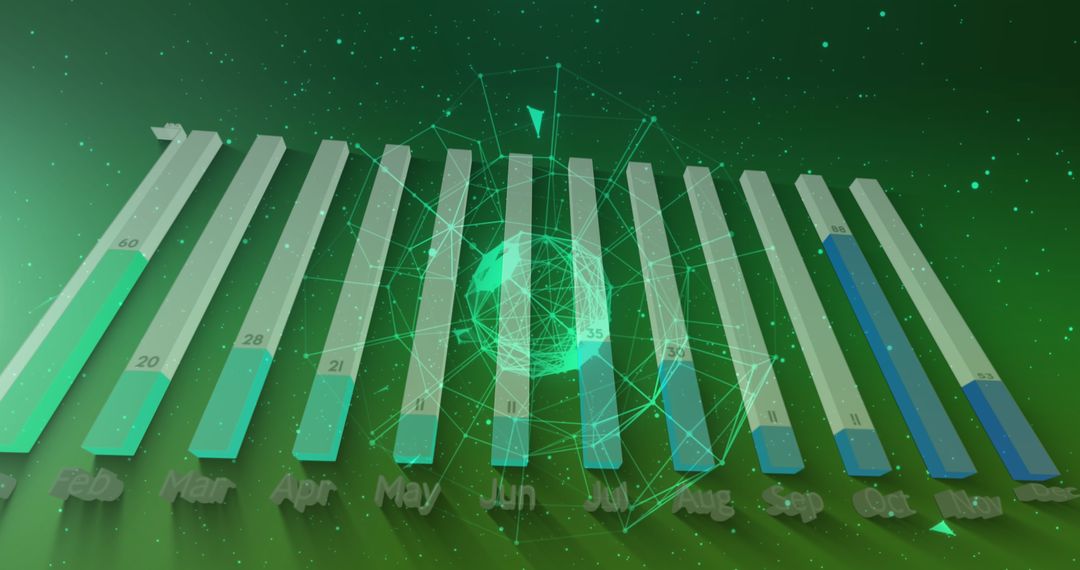
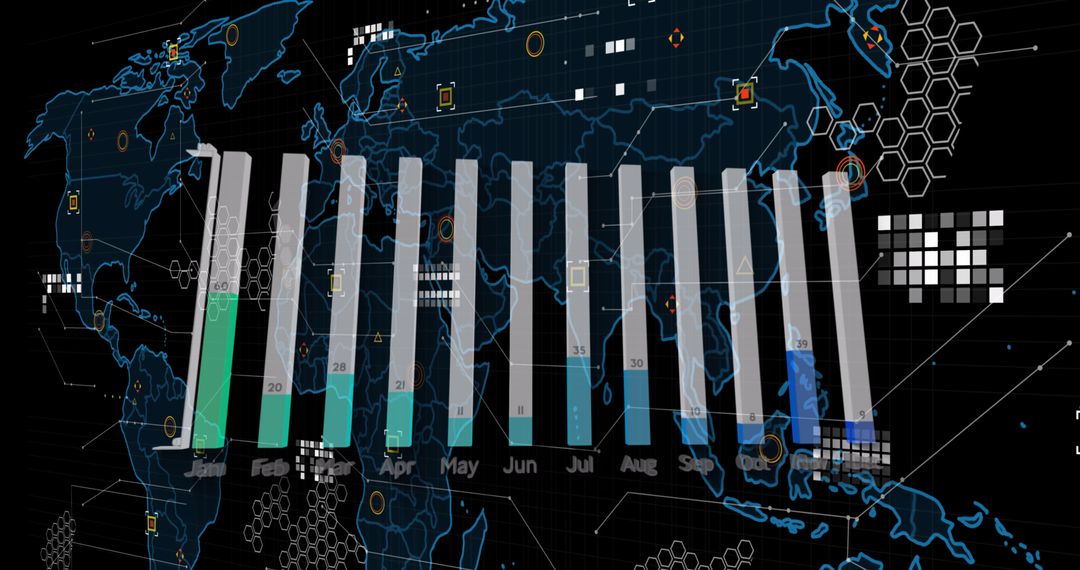
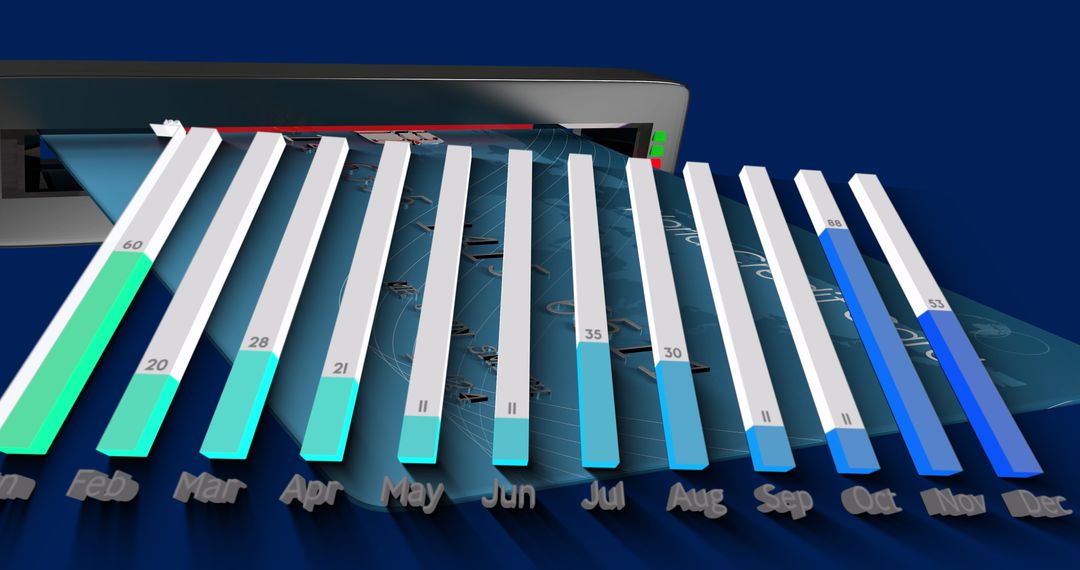
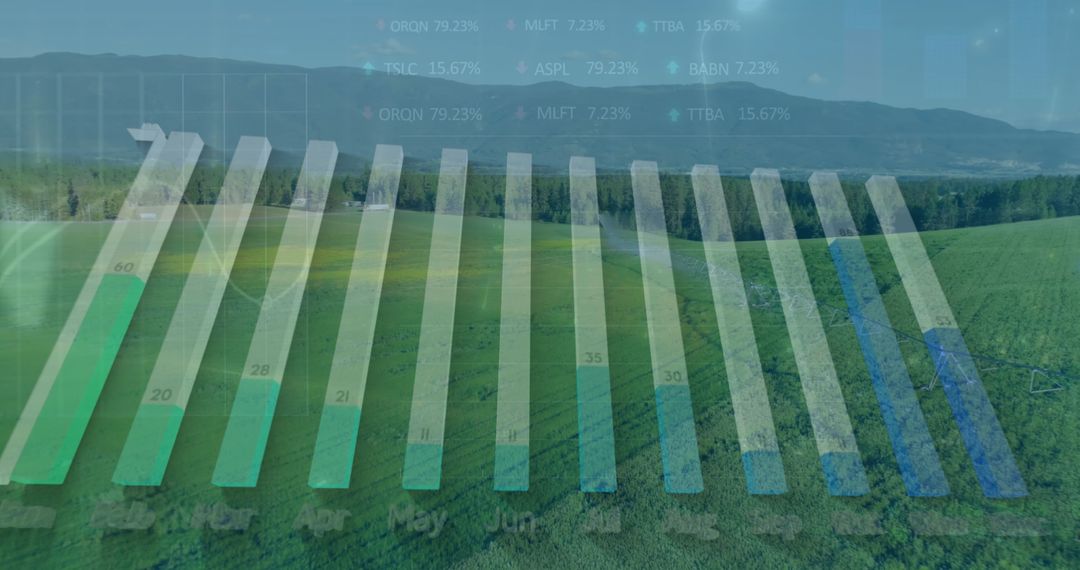
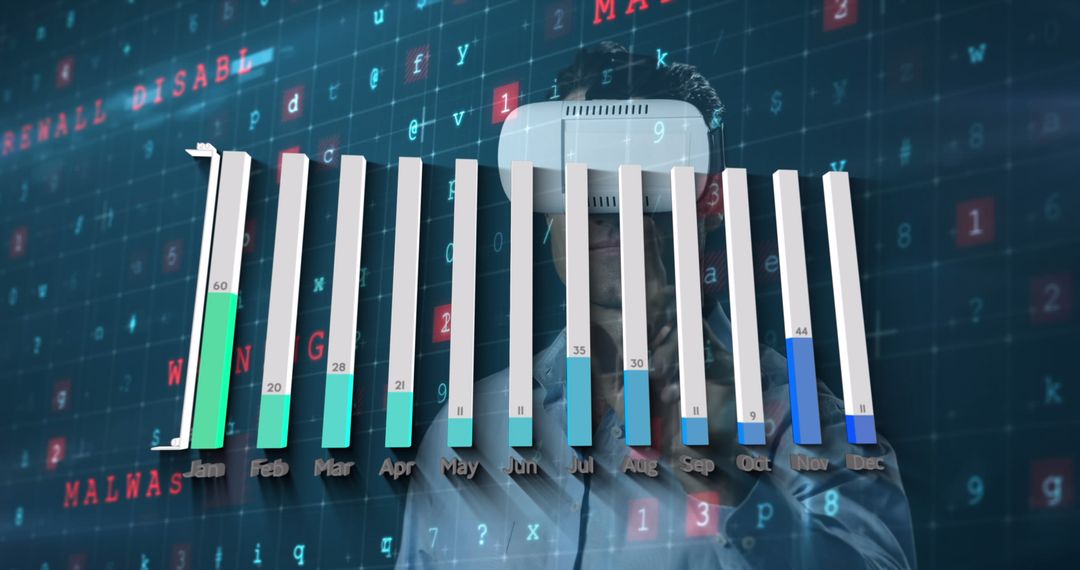
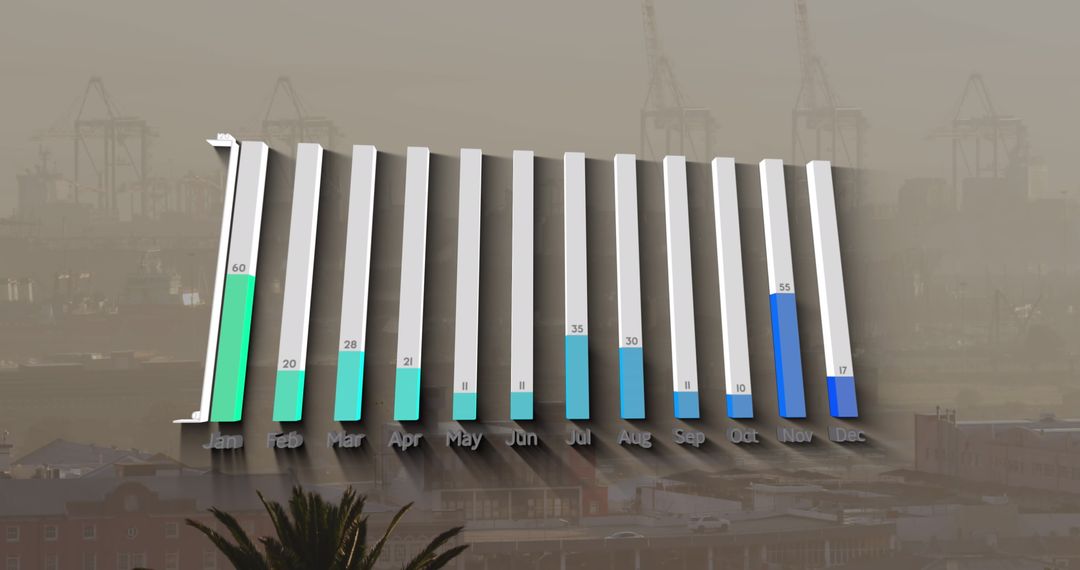
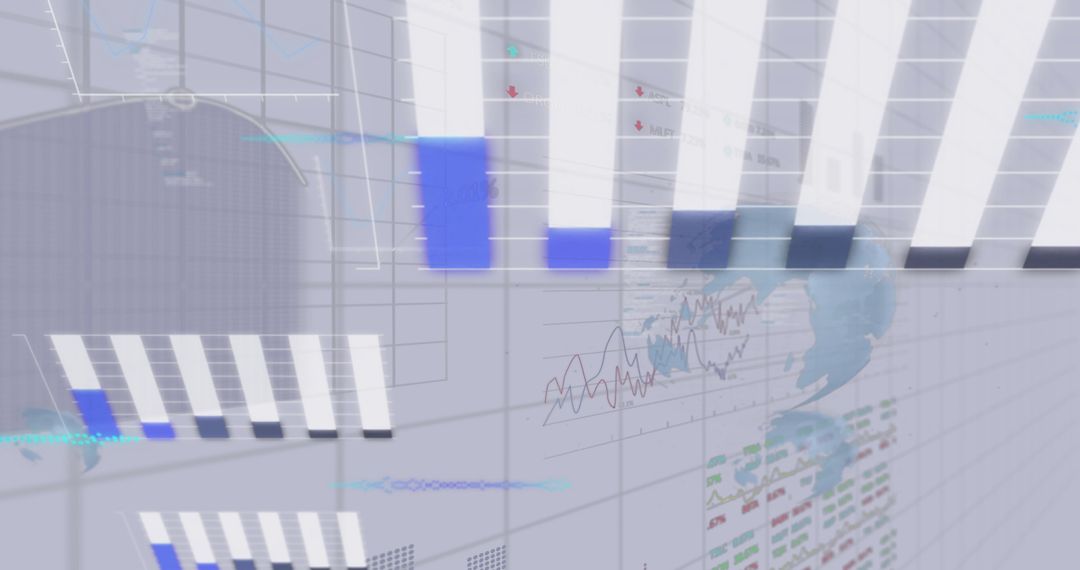
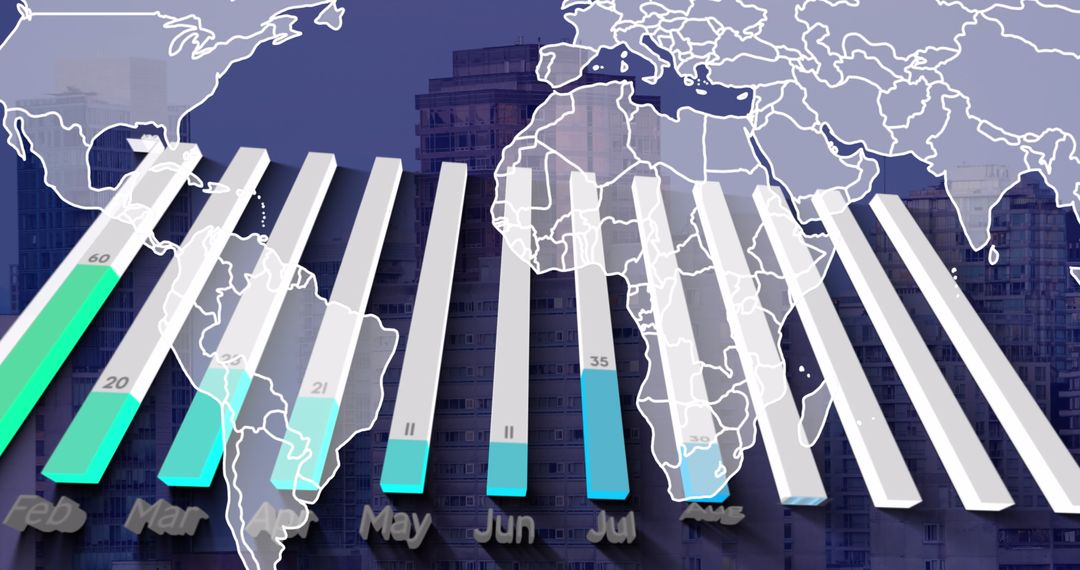
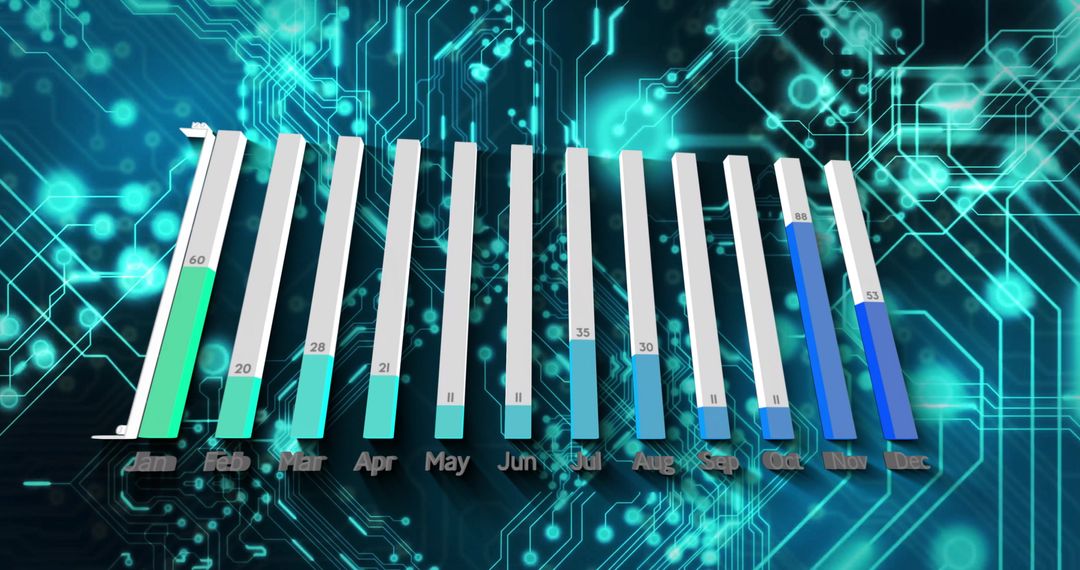
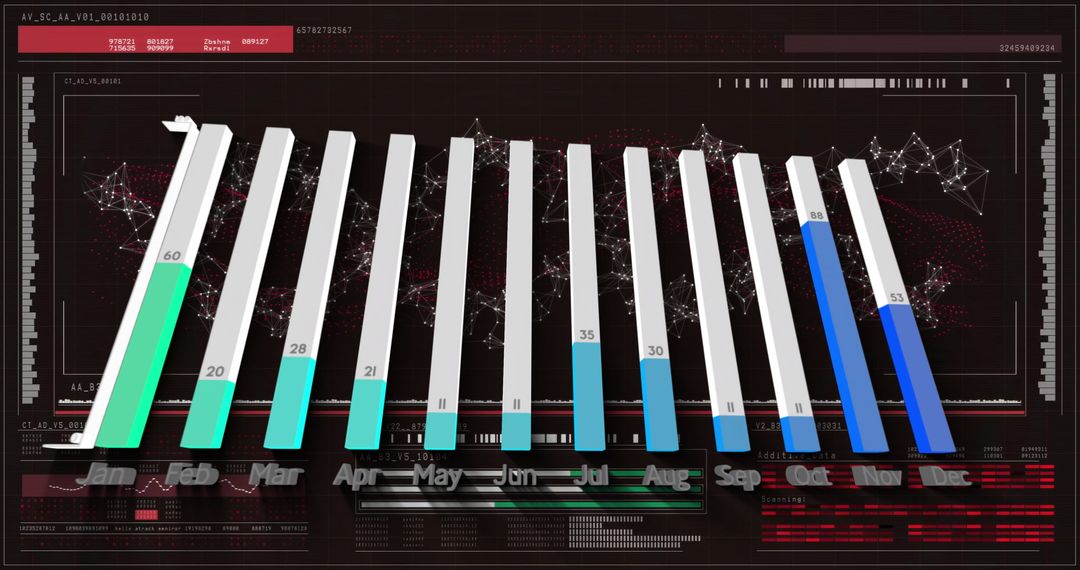
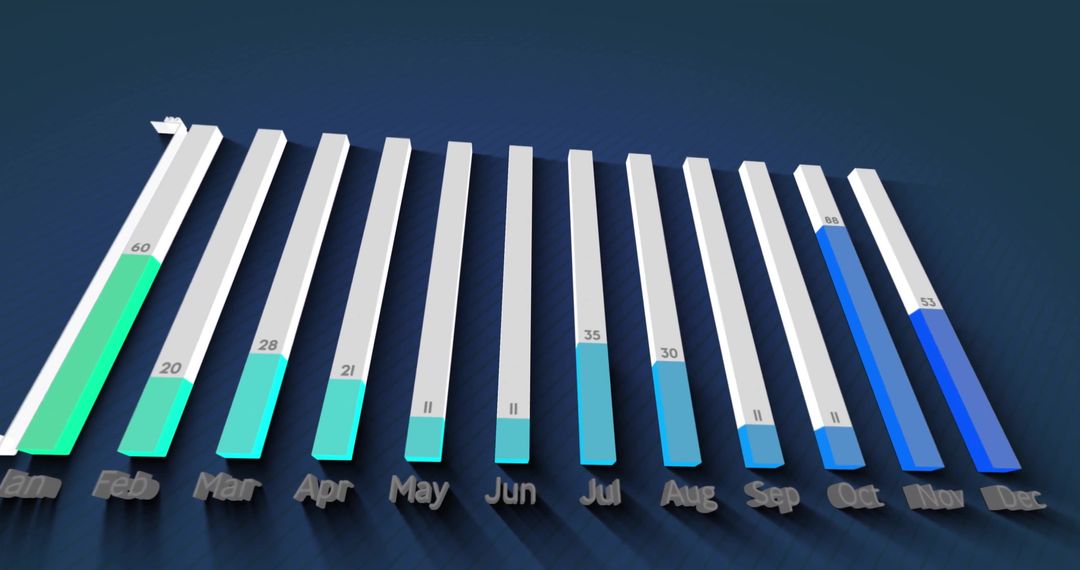
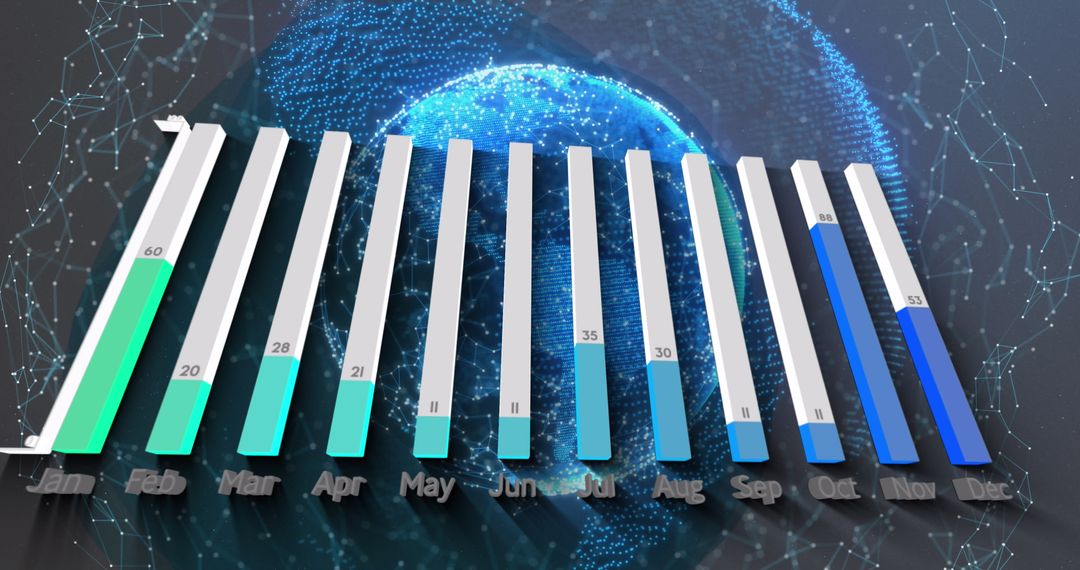
3D rendering of a bar chart depicting financial data across months on a modern purple background. Serves as a visual tool for financial analysis, suitable for presentations on financial performance, investment tracking, and economic reporting. Useful in business reports, financial seminars, or educational content on technology in finance.
Powered by 


3
downloads
downloads
Tags:
More
Credit Photo
If you would like to credit the Photo, here are some ways you can do so
Text Link
photo Link
<span class="text-link">
<span>
<a target="_blank" href=https://pikwizard.com/photo/3d-financial-data-chart-on-futuristic-purple-background/eba3b766a2d9c51c9d272e93e8f3420f/>PikWizard</a>
</span>
</span>
<span class="image-link">
<span
style="margin: 0 0 20px 0; display: inline-block; vertical-align: middle; width: 100%;"
>
<a
target="_blank"
href="https://pikwizard.com/photo/3d-financial-data-chart-on-futuristic-purple-background/eba3b766a2d9c51c9d272e93e8f3420f/"
style="text-decoration: none; font-size: 10px; margin: 0;"
>
<img src="https://pikwizard.com/pw/medium/eba3b766a2d9c51c9d272e93e8f3420f.jpg" style="margin: 0; width: 100%;" alt="" />
<p style="font-size: 12px; margin: 0;">PikWizard</p>
</a>
</span>
</span>
Free (free of charge)
Free for personal and commercial use.
Author: Awesome Content
Similar Free Stock Images

Premium


Premium


Premium


Premium


Premium


Premium

Premium
Premium


Premium


Premium


Premium


Premium


Premium


Premium


Premium


Premium


Premium


Premium


Premium


Premium


Premium


Premium


Premium


Premium