
- Home >
- Stock Photos >
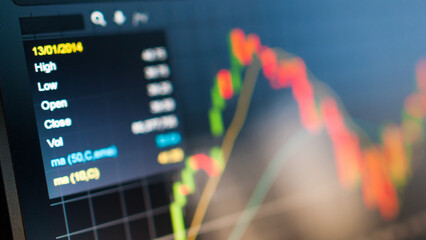
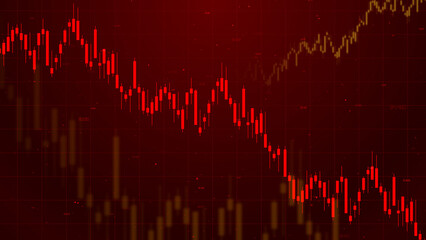
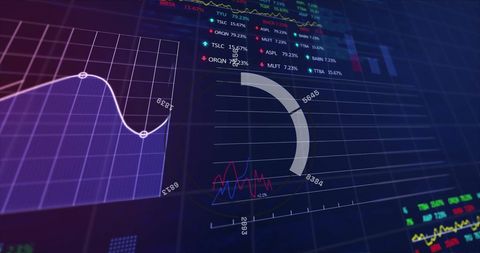
- 3D Financial Data Representation with Digital Dashboard Elements
3D Financial Data Representation with Digital Dashboard Elements Image

Visual elements illustrate dynamic financial data and stock performance through digital tonality. Useful in articles, presentations or simulations focusing on economic trends, trading strategies, and global business analytics. Perfect for conveying the concept of sophisticated data evaluation and real-time business intelligence.
Powered by 


downloads
Tags:
More
Credit Photo
If you would like to credit the Photo, here are some ways you can do so
Text Link
photo Link
<span class="text-link">
<span>
<a target="_blank" href=https://pikwizard.com/photo/3d-financial-data-representation-with-digital-dashboard-elements/de0e5ed88c3bb9b8419d552b3053cb0c/>PikWizard</a>
</span>
</span>
<span class="image-link">
<span
style="margin: 0 0 20px 0; display: inline-block; vertical-align: middle; width: 100%;"
>
<a
target="_blank"
href="https://pikwizard.com/photo/3d-financial-data-representation-with-digital-dashboard-elements/de0e5ed88c3bb9b8419d552b3053cb0c/"
style="text-decoration: none; font-size: 10px; margin: 0;"
>
<img src="https://pikwizard.com/pw/medium/de0e5ed88c3bb9b8419d552b3053cb0c.jpg" style="margin: 0; width: 100%;" alt="" />
<p style="font-size: 12px; margin: 0;">PikWizard</p>
</a>
</span>
</span>
Free (free of charge)
Free for personal and commercial use.
Author: Awesome Content
Similar Free Stock Images

Premium


Premium

Premium


Premium

Premium


Premium


Premium


Premium


Premium


Premium


Premium


Premium


Premium


Premium


Premium


Premium


Premium


Premium

Premium


Premium


Premium


Premium


Premium


Premium


Premium

Explore More Free Stock Images