- Home >
- Stock Photos >
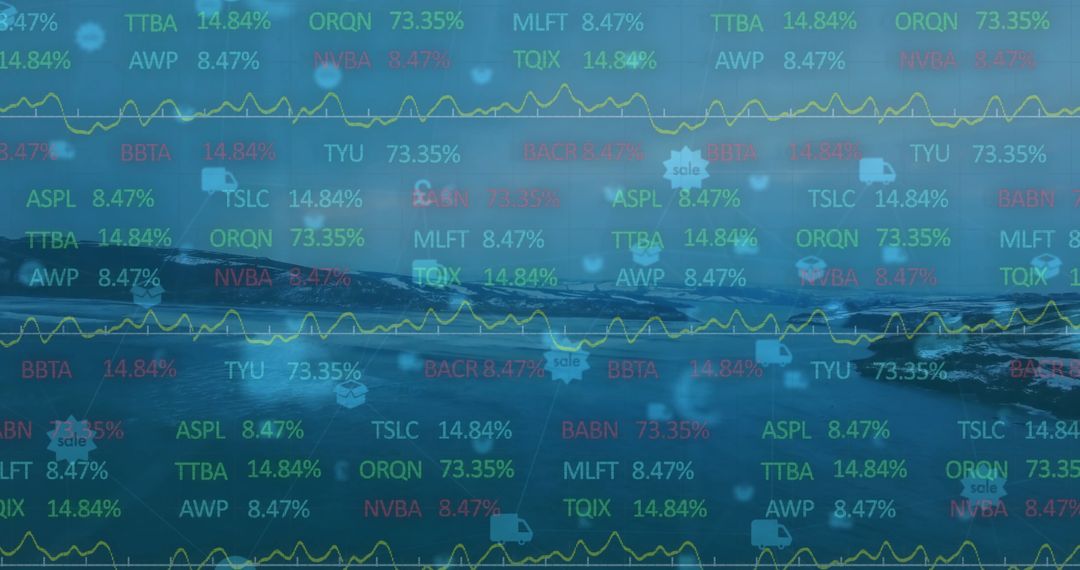
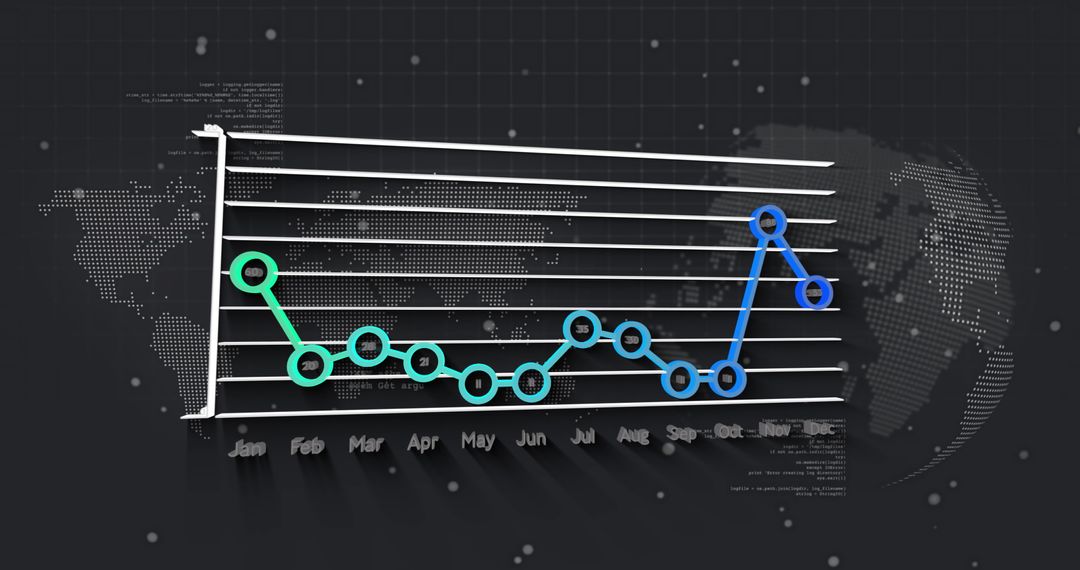
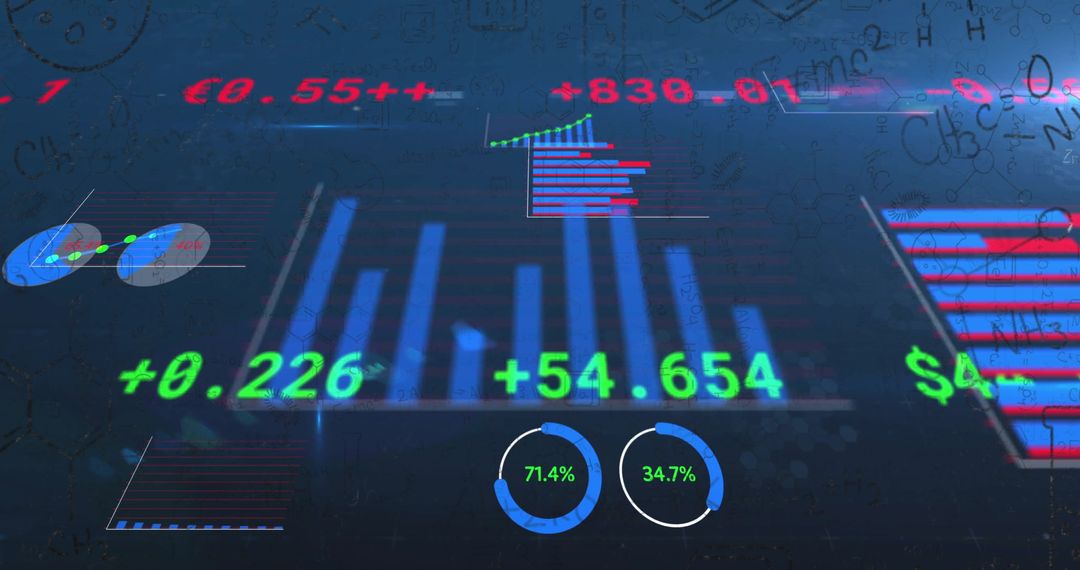
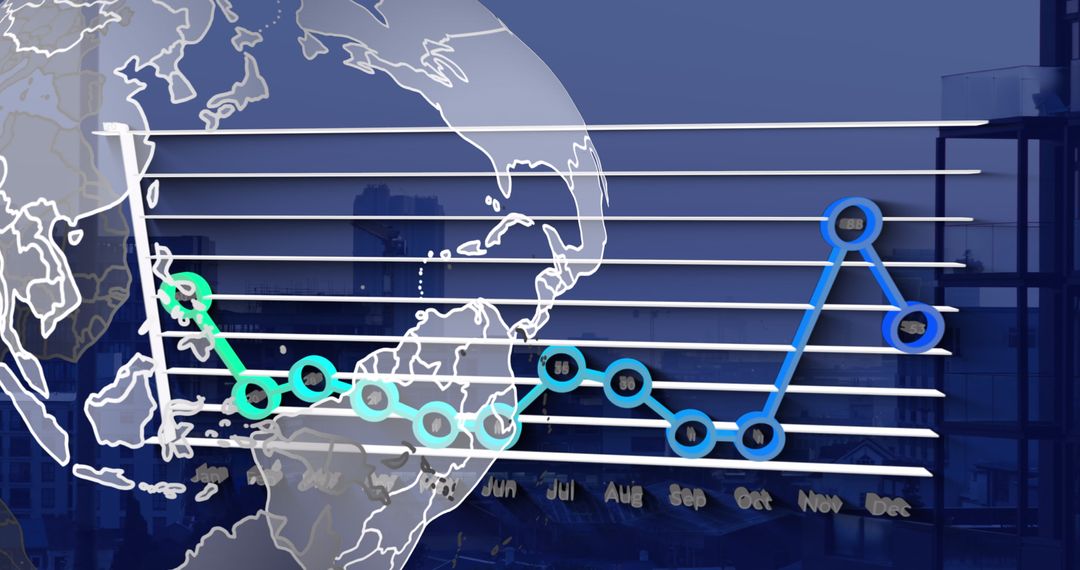
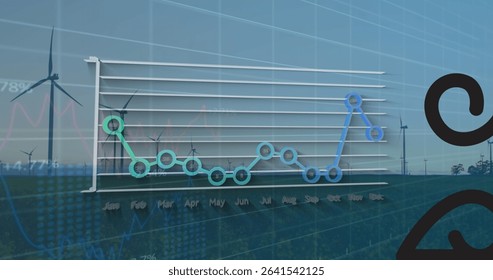
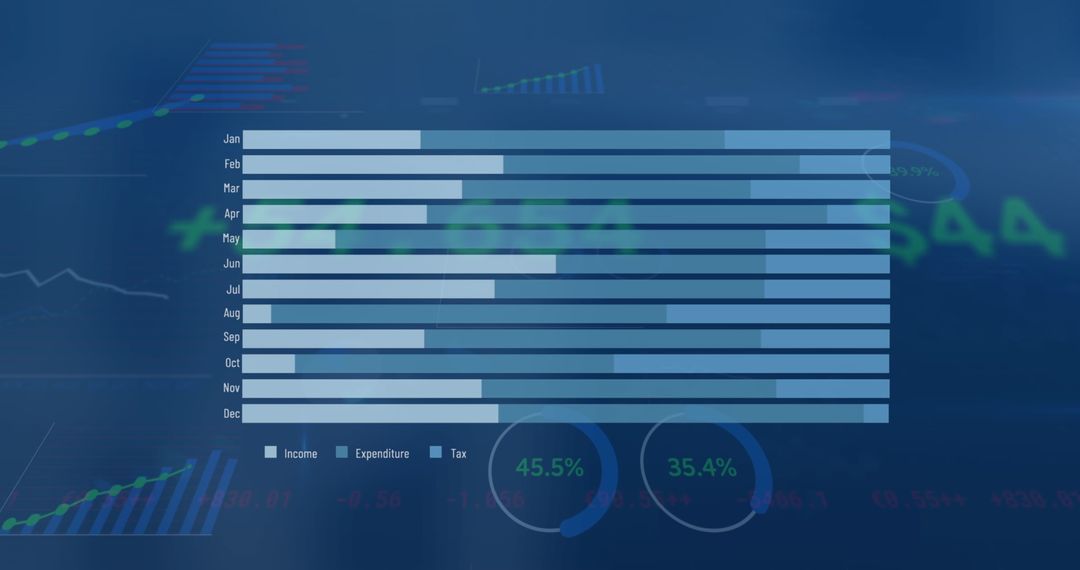
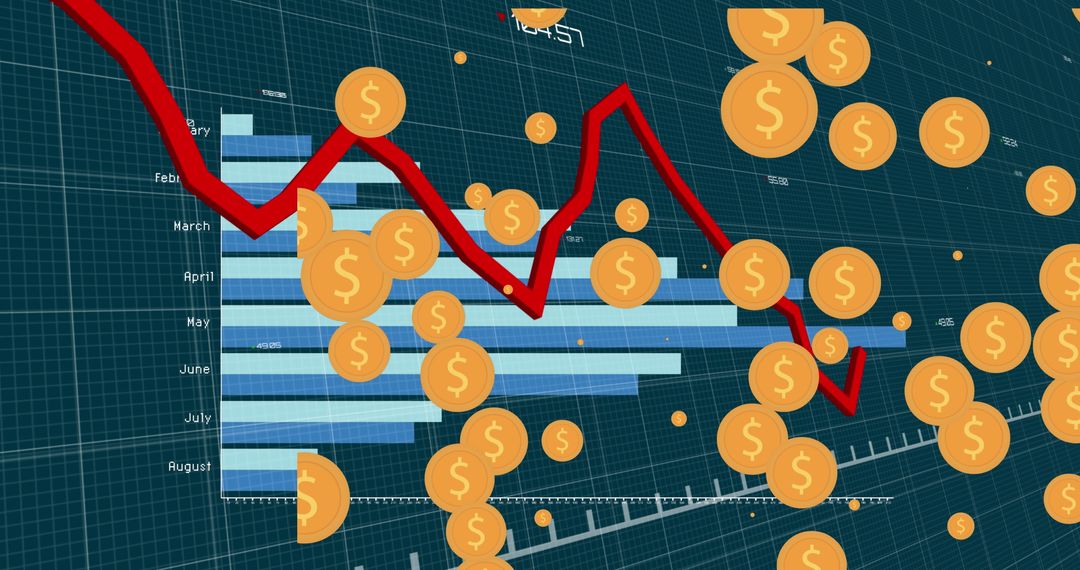
- 3D Financial Line Graph with Digital Visualizations and Tickers
3D Financial Line Graph with Digital Visualizations and Tickers Image

Graph displays January to December data with line representing financial or business performance. Background includes digital patterns, financial tickers, and cityscape silhouettes, combining analytics and technology. Useful for presentations, reports, or business websites focused on data-driven content.
Powered by  - Get 15% off with code: PIKWIZARD15


2
downloads
downloads
Tags:
More
Credit Photo
If you would like to credit the Photo, here are some ways you can do so
Text Link
photo Link
<span class="text-link">
<span>
<a target="_blank" href=https://pikwizard.com/photo/3d-financial-line-graph-with-digital-visualizations-and-tickers/74e6ce9ade6721b5eb7e42f6240aff93/>PikWizard</a>
</span>
</span>
<span class="image-link">
<span
style="margin: 0 0 20px 0; display: inline-block; vertical-align: middle; width: 100%;"
>
<a
target="_blank"
href="https://pikwizard.com/photo/3d-financial-line-graph-with-digital-visualizations-and-tickers/74e6ce9ade6721b5eb7e42f6240aff93/"
style="text-decoration: none; font-size: 10px; margin: 0;"
>
<img src="https://pikwizard.com/pw/medium/74e6ce9ade6721b5eb7e42f6240aff93.jpg" style="margin: 0; width: 100%;" alt="" />
<p style="font-size: 12px; margin: 0;">PikWizard</p>
</a>
</span>
</span>
Free (free of charge)
Free for personal and commercial use.
Author: Creative Art
Similar Free Stock Images

Premium


Premium


Premium


Premium


Premium


Premium


Premium


Premium


Premium


Premium


Premium


Premium


Premium


Premium


Premium


Premium


Premium


Premium


Premium


Premium


Premium


Premium


Premium


Premium