- Home >
- Stock Photos >
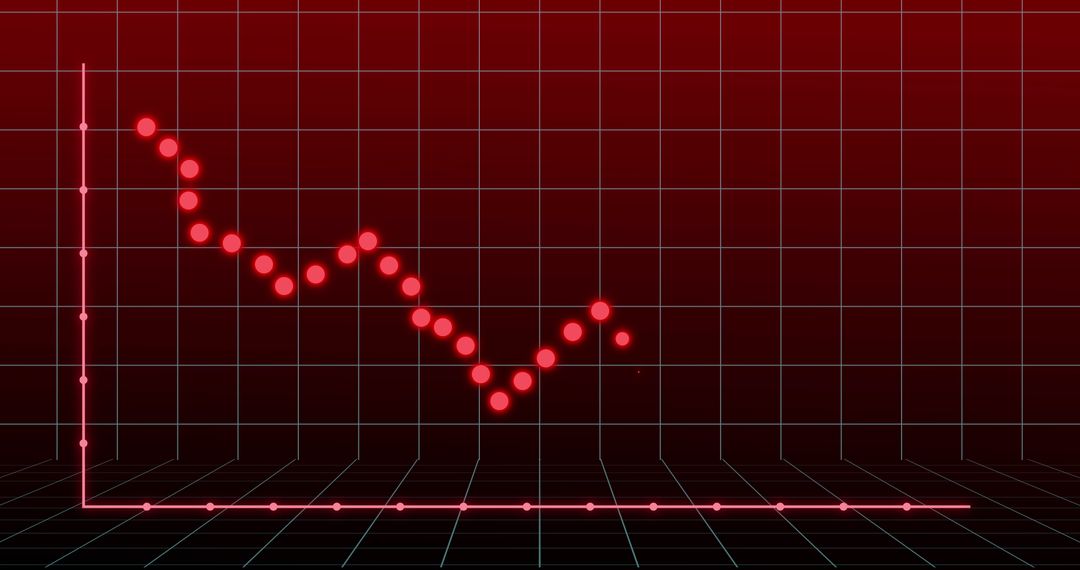
- 3D Financial Market Analysis with Declining Stock Graph
3D Financial Market Analysis with Declining Stock Graph Image

This visually striking representation of a financial chart showcases declining stock figures through dynamic red and green bars. Perfect for illustrating economic downturns, finance articles, or analytics presentations, this visual helps convey concepts related to market trends and statistics.
Powered by 


2
downloads
downloads
Tags:
More
Credit Photo
If you would like to credit the Photo, here are some ways you can do so
Text Link
photo Link
<span class="text-link">
<span>
<a target="_blank" href=https://pikwizard.com/photo/3d-financial-market-analysis-with-declining-stock-graph/191c014f4537ef96c3b7fabdca4c80a4/>PikWizard</a>
</span>
</span>
<span class="image-link">
<span
style="margin: 0 0 20px 0; display: inline-block; vertical-align: middle; width: 100%;"
>
<a
target="_blank"
href="https://pikwizard.com/photo/3d-financial-market-analysis-with-declining-stock-graph/191c014f4537ef96c3b7fabdca4c80a4/"
style="text-decoration: none; font-size: 10px; margin: 0;"
>
<img src="https://pikwizard.com/pw/medium/191c014f4537ef96c3b7fabdca4c80a4.jpg" style="margin: 0; width: 100%;" alt="" />
<p style="font-size: 12px; margin: 0;">PikWizard</p>
</a>
</span>
</span>
Free (free of charge)
Free for personal and commercial use.
Author: Authentic Images
Similar Free Stock Images

Premium


Premium


Premium


Premium


Premium


Premium


Premium


Premium


Premium


Premium


Premium


Premium


Premium


Premium


Premium


Premium


Premium


Premium


Premium


Premium


Premium


Premium


Premium


Premium