- Home >
- Stock Photos >
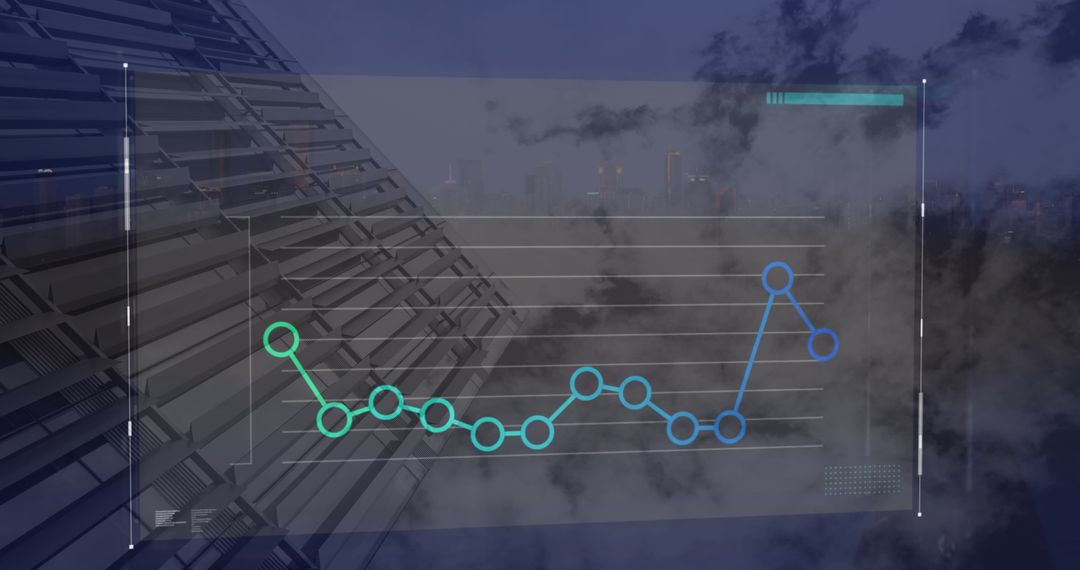
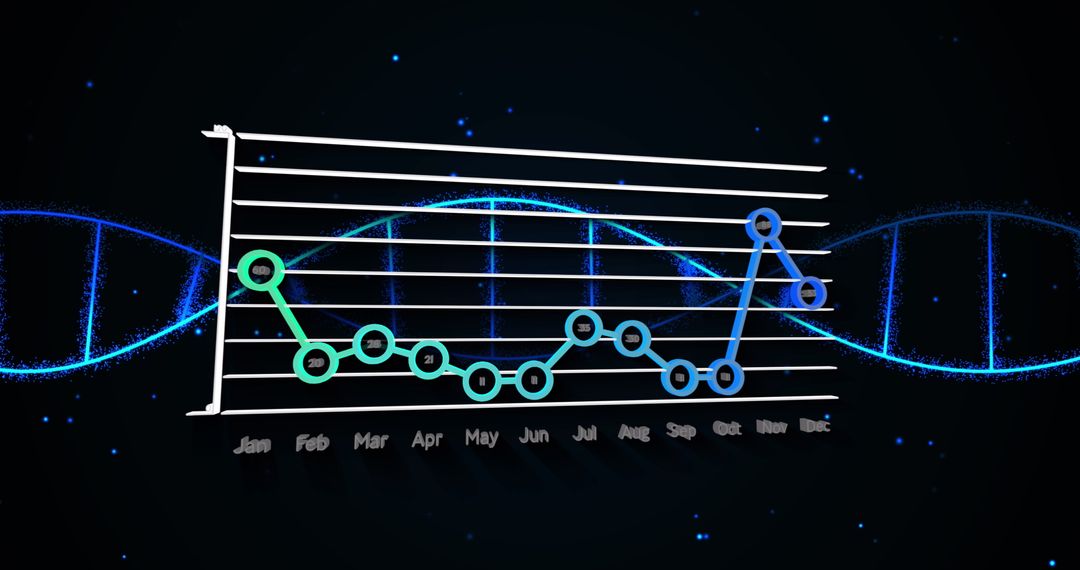
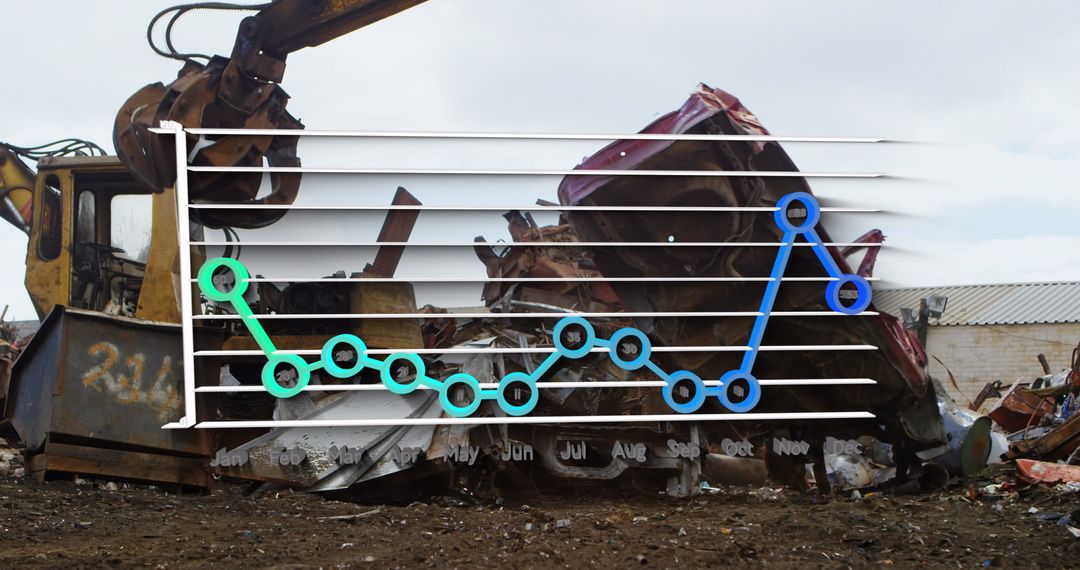
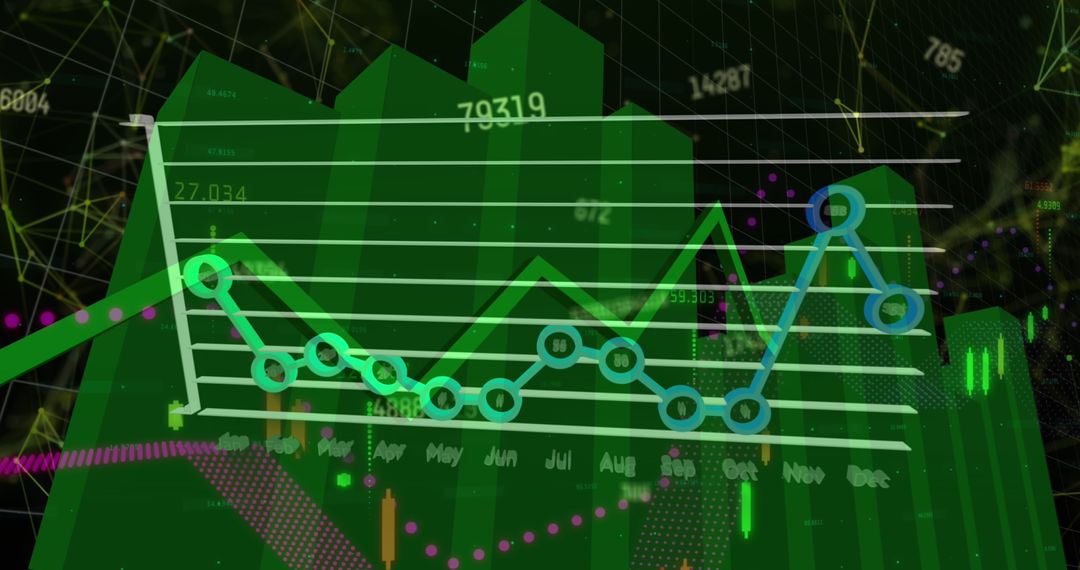
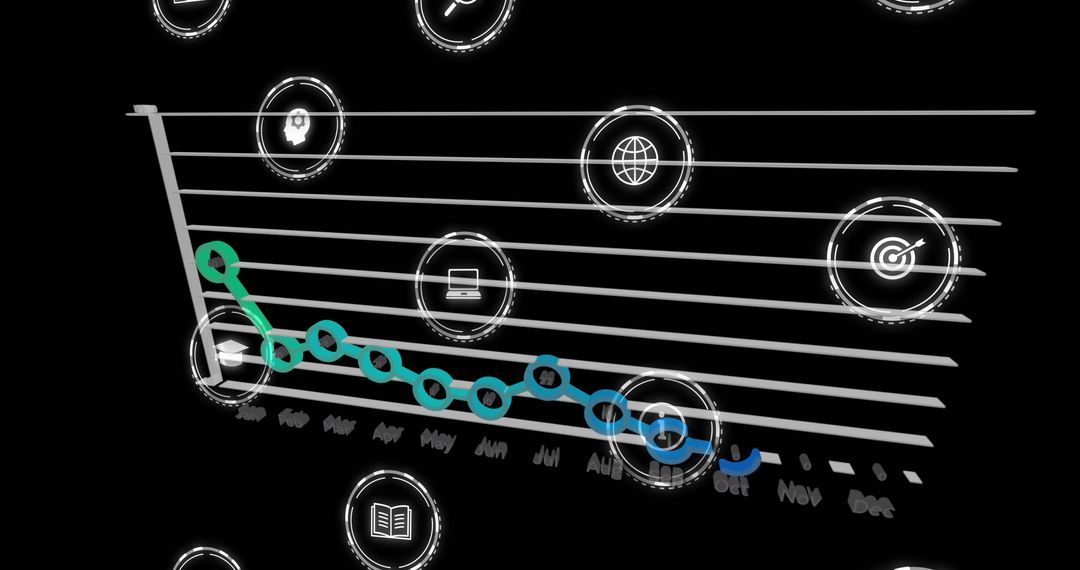
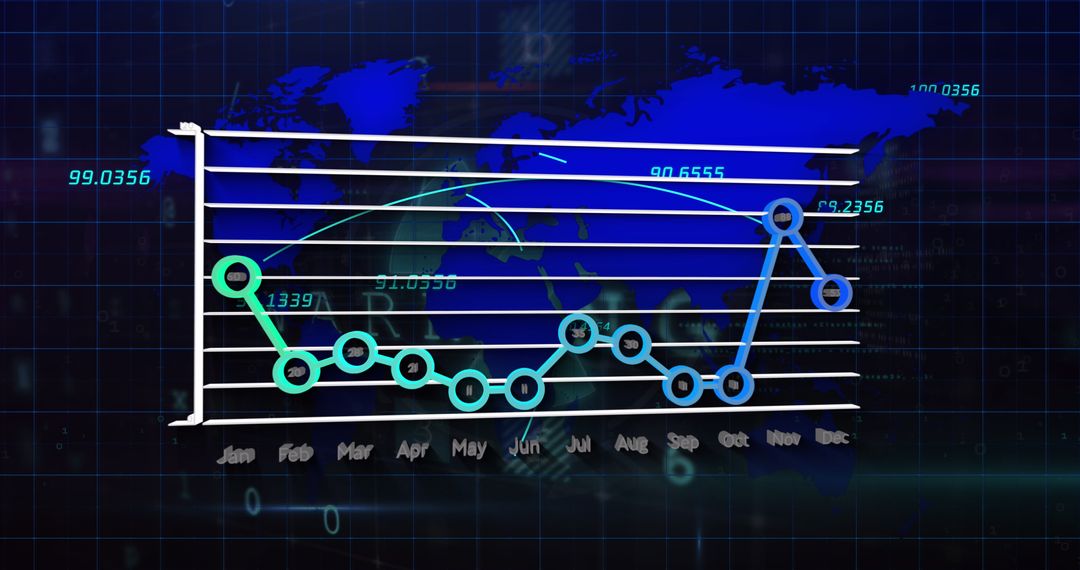
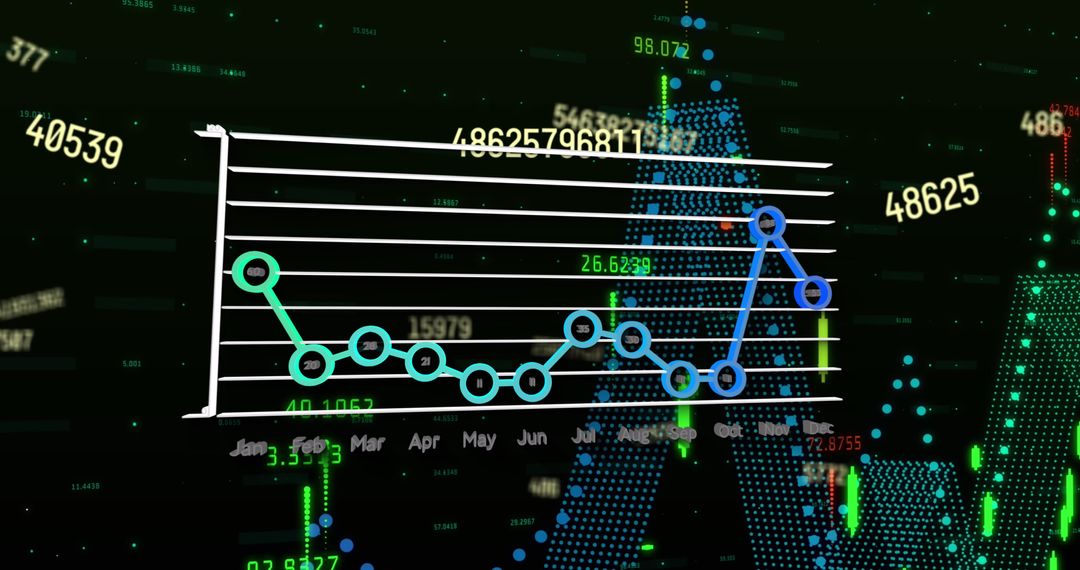
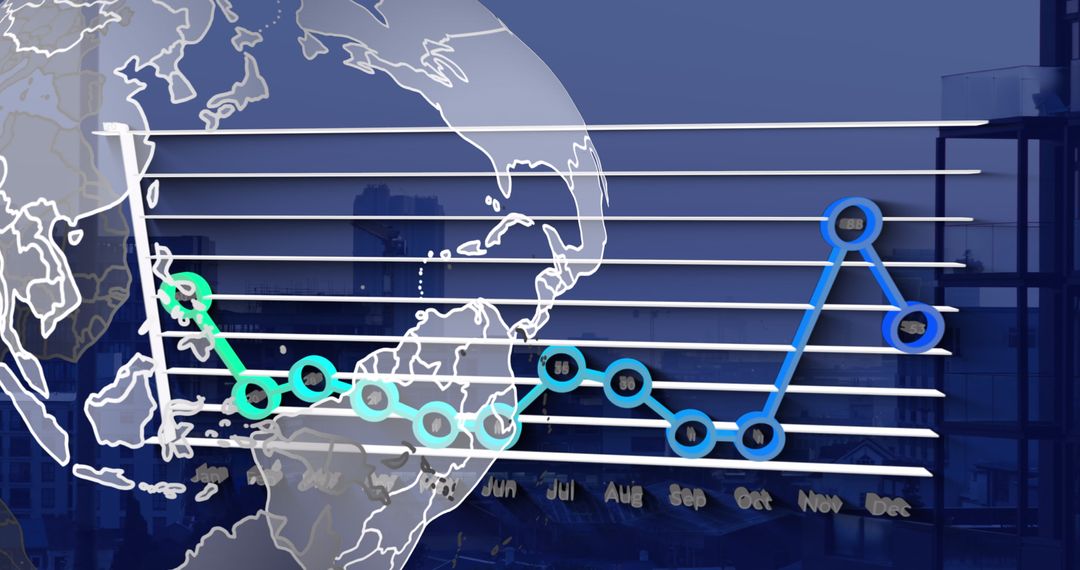
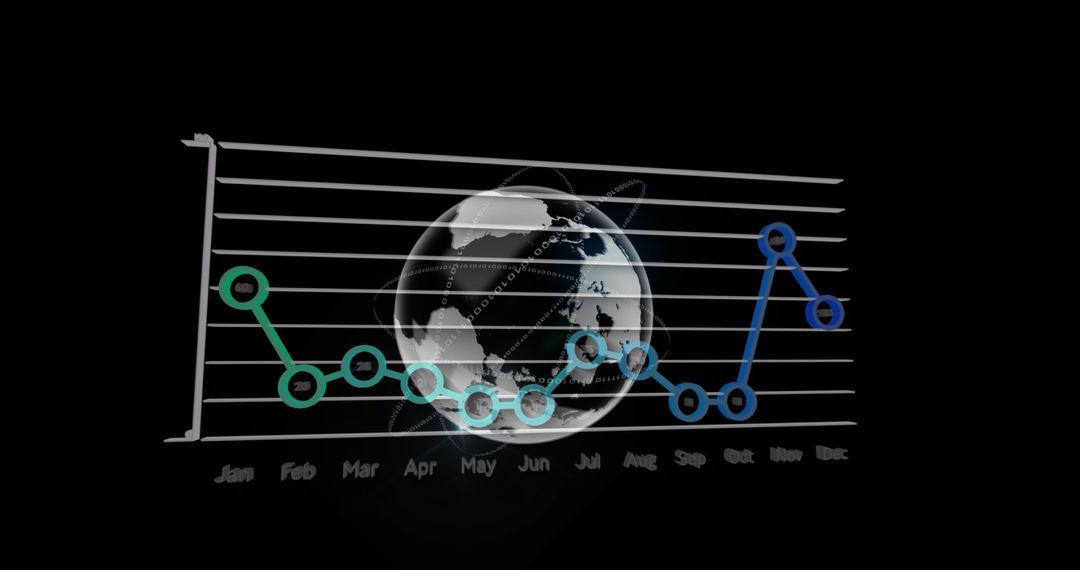
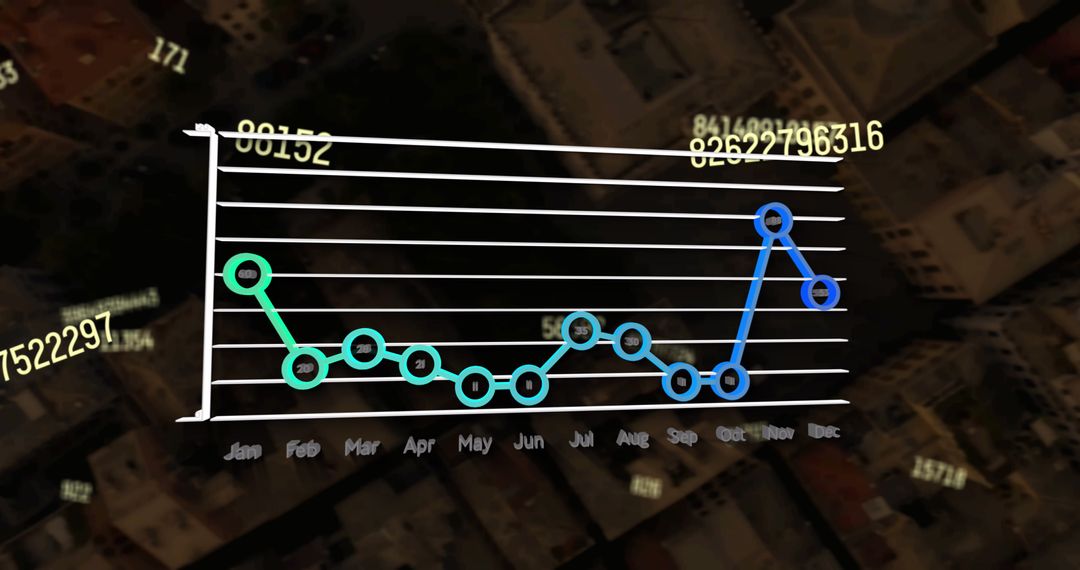
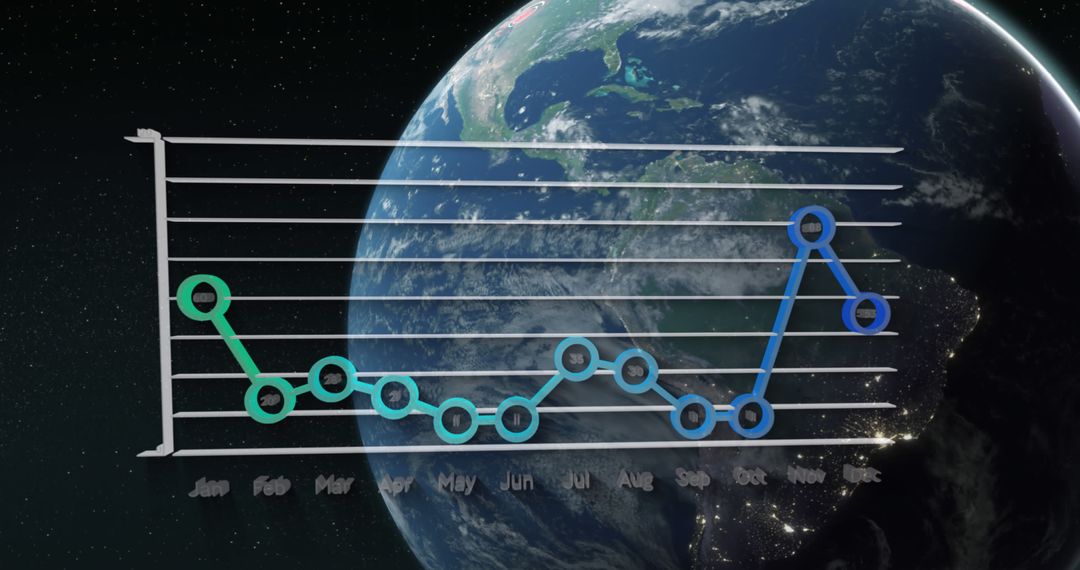
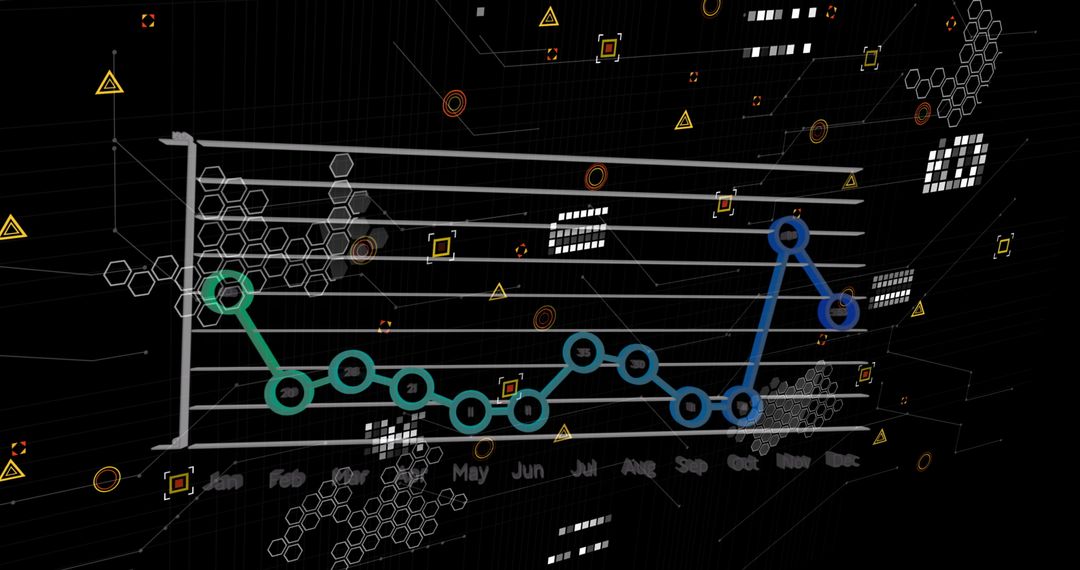
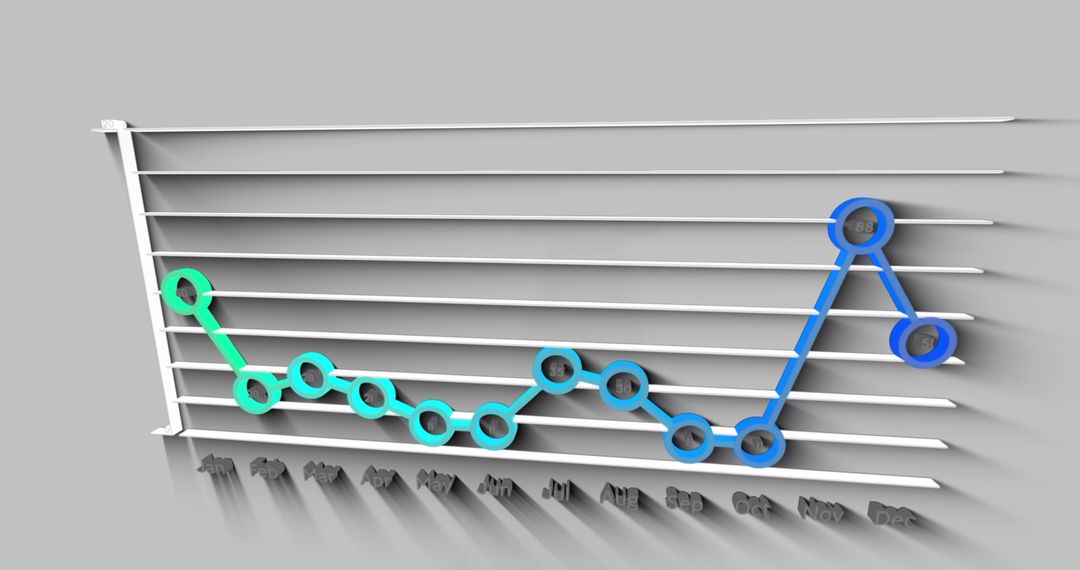
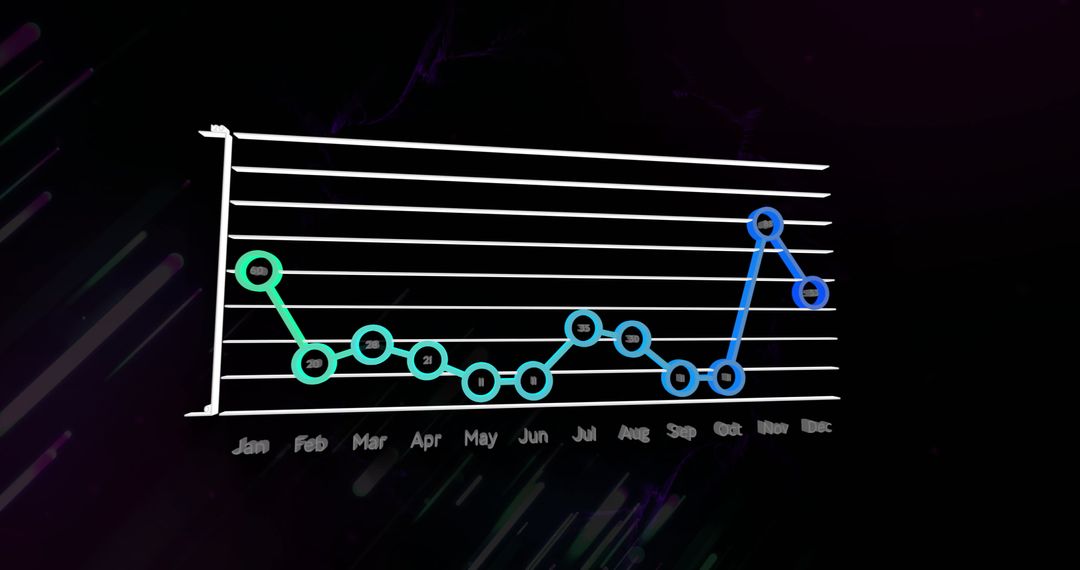
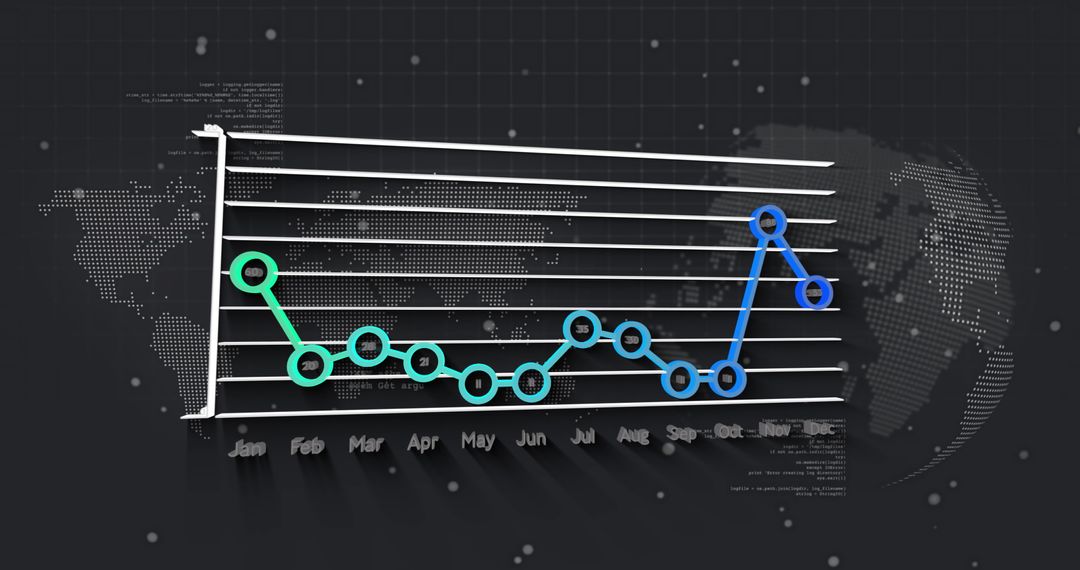
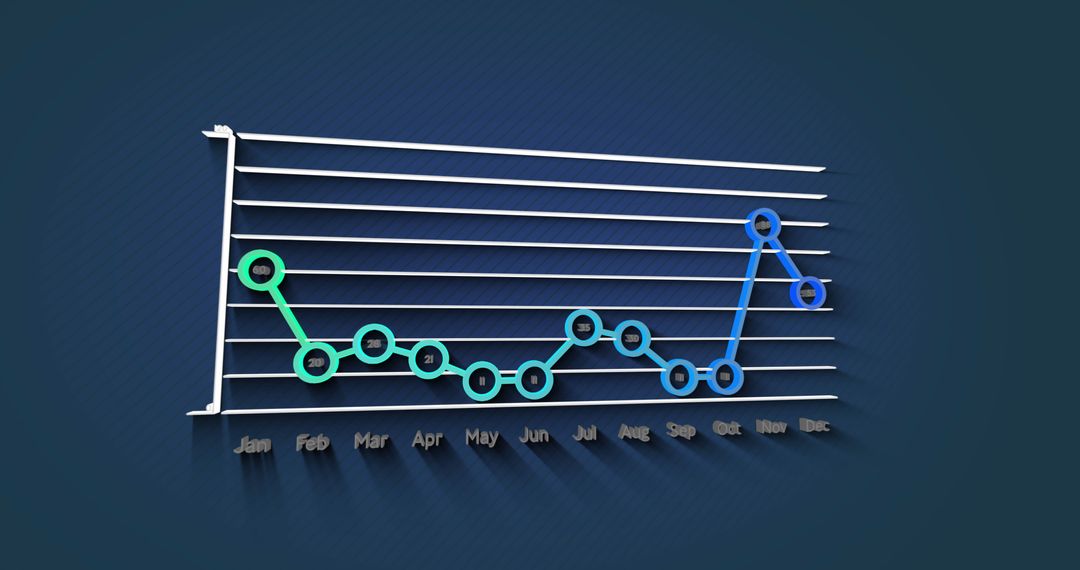
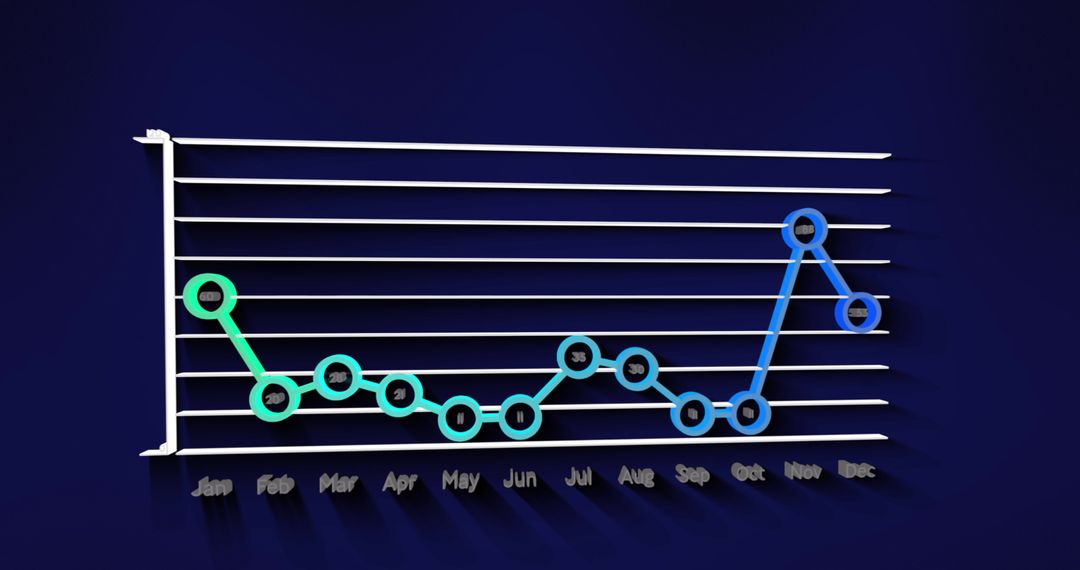
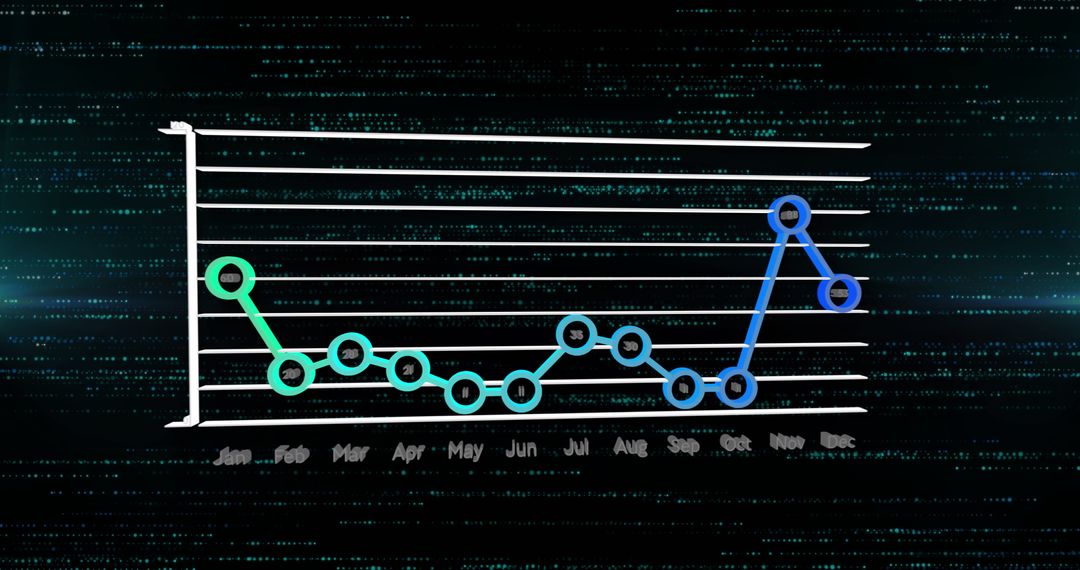
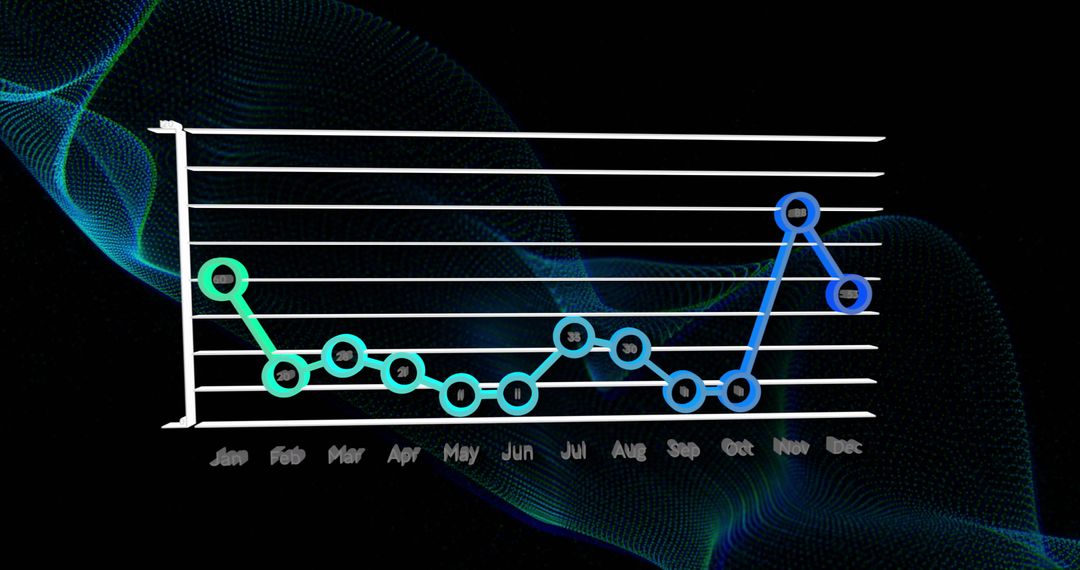
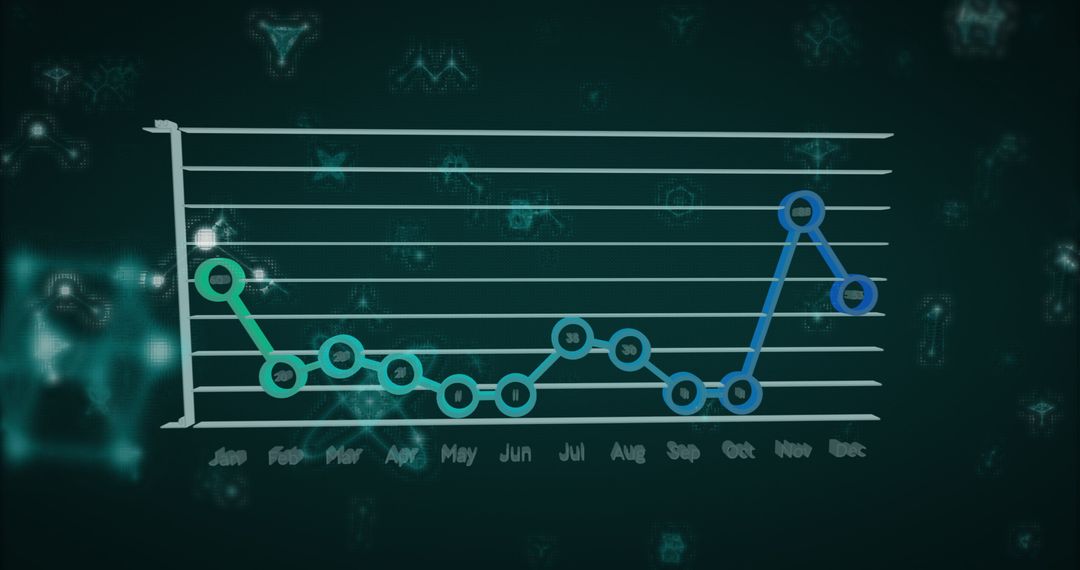
- 3D Graph Depicting Monthly Trends with Gradient Connections
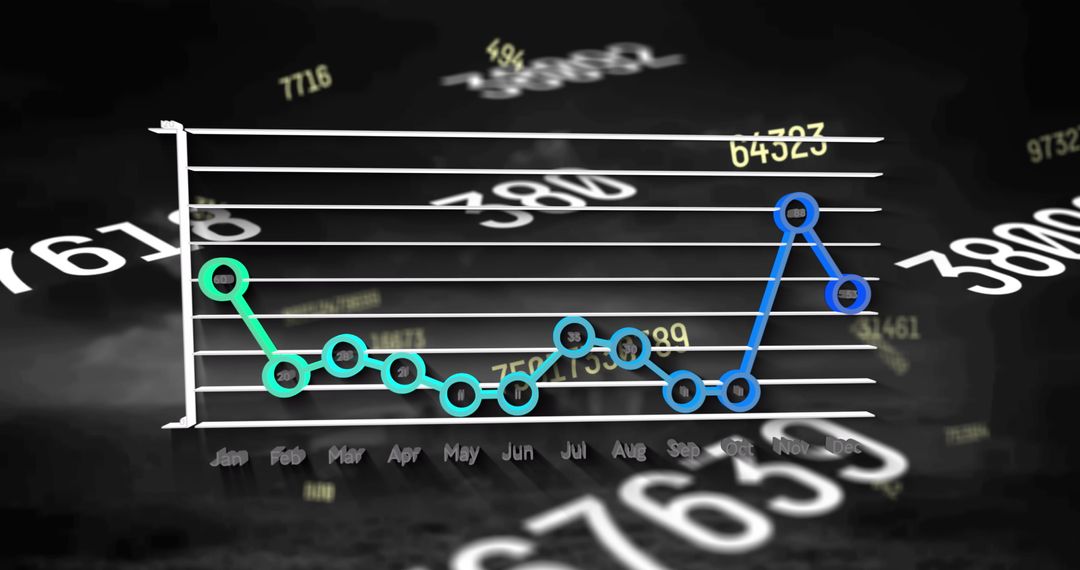
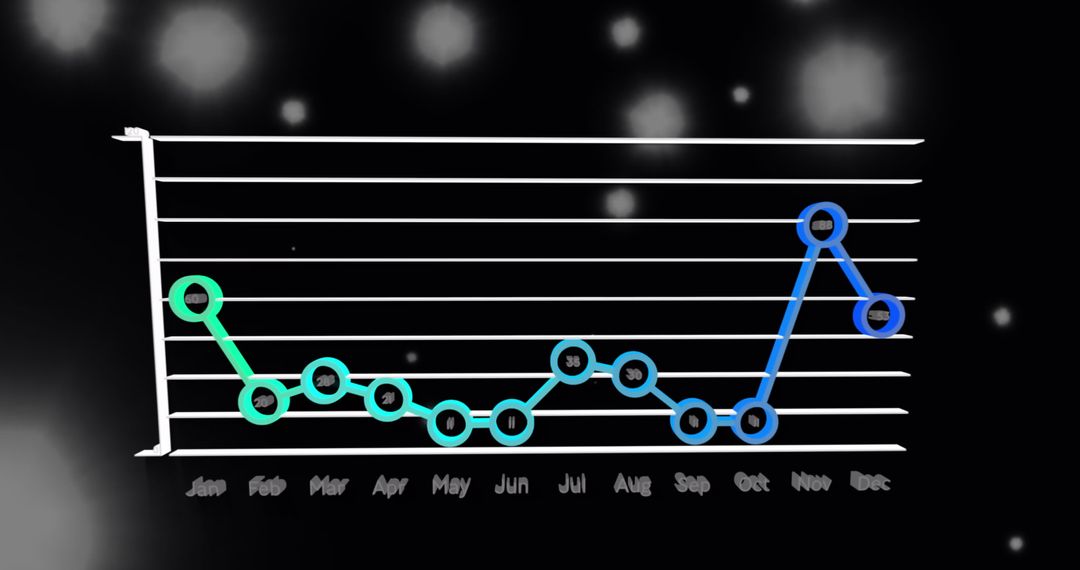
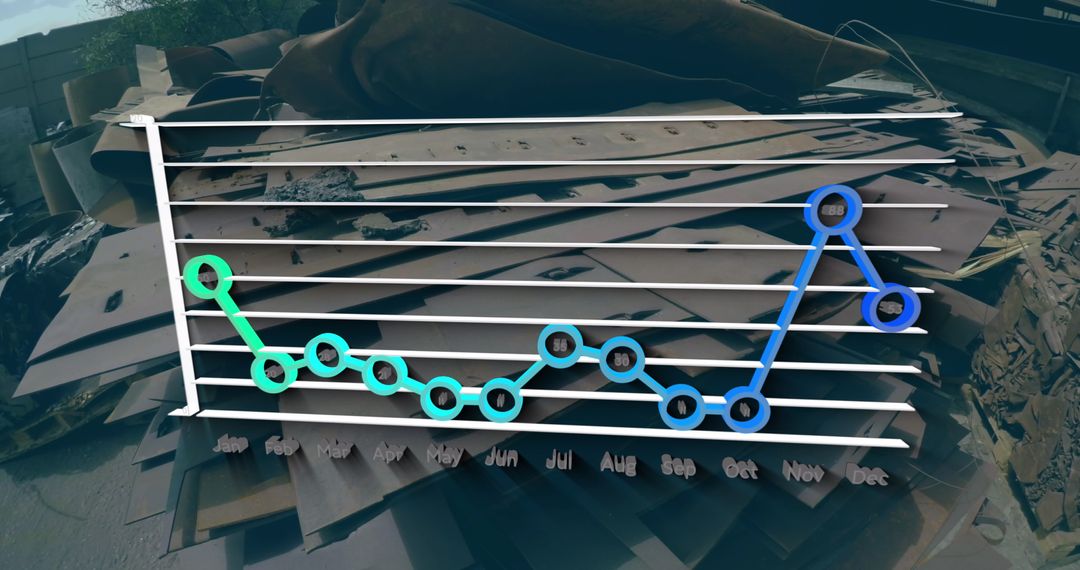
3D Graph Depicting Monthly Trends with Gradient Connections Image

The image displays a sleek 3D graph illustrating monthly trends, with lines connecting data points in a gradient color design on a navy background. Each data point is clearly marked from January to December, depicting months as the axis labels. Ideal for use in business presentations, statistical analysis reports, and infographics illustrating market trends or annual progress. The vivid color scheme and three-dimensional style make this chart appealing for technology and business-oriented discussions and visual content.
Powered by 


2
downloads
downloads
Tags:
More
Credit Photo
If you would like to credit the Photo, here are some ways you can do so
Text Link
photo Link
<span class="text-link">
<span>
<a target="_blank" href=https://pikwizard.com/photo/3d-graph-depicting-monthly-trends-with-gradient-connections/fba66d0849418cd71a05d1f506c6c491/>PikWizard</a>
</span>
</span>
<span class="image-link">
<span
style="margin: 0 0 20px 0; display: inline-block; vertical-align: middle; width: 100%;"
>
<a
target="_blank"
href="https://pikwizard.com/photo/3d-graph-depicting-monthly-trends-with-gradient-connections/fba66d0849418cd71a05d1f506c6c491/"
style="text-decoration: none; font-size: 10px; margin: 0;"
>
<img src="https://pikwizard.com/pw/medium/fba66d0849418cd71a05d1f506c6c491.jpg" style="margin: 0; width: 100%;" alt="" />
<p style="font-size: 12px; margin: 0;">PikWizard</p>
</a>
</span>
</span>
Free (free of charge)
Free for personal and commercial use.
Author: Awesome Content
Similar Free Stock Images