- Home >
- Stock Photos >
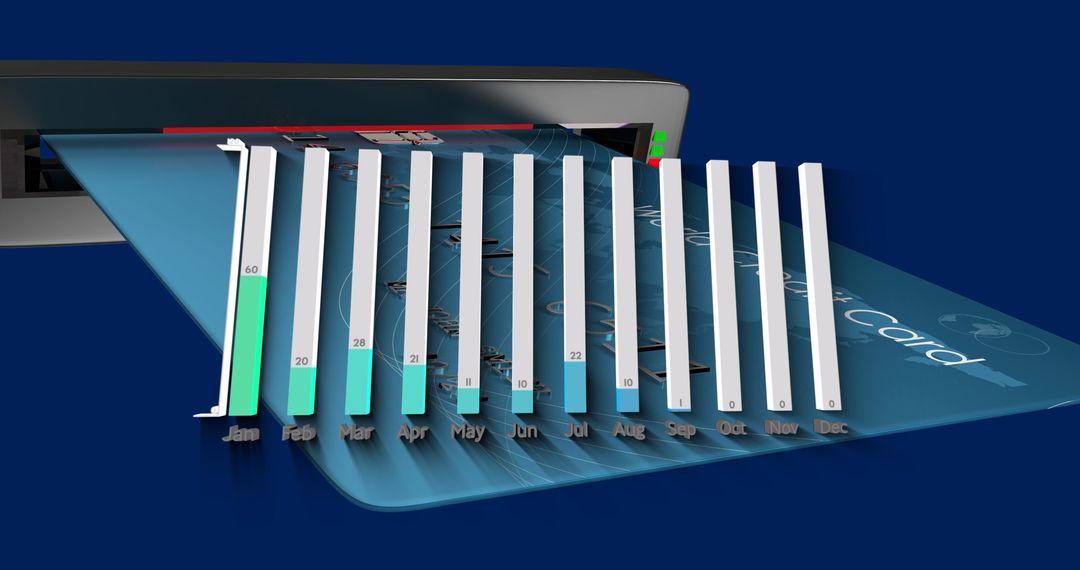
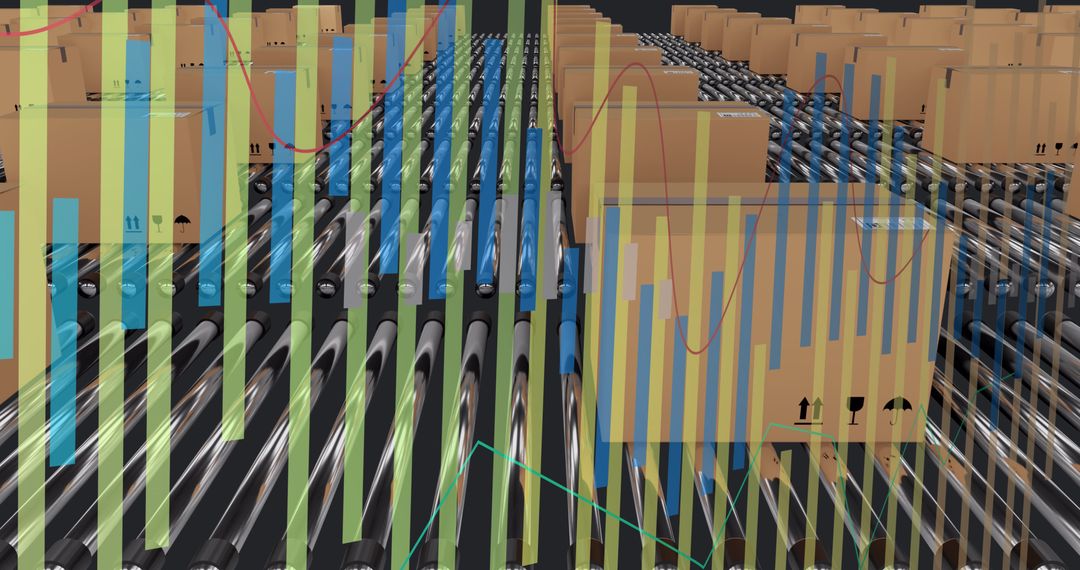
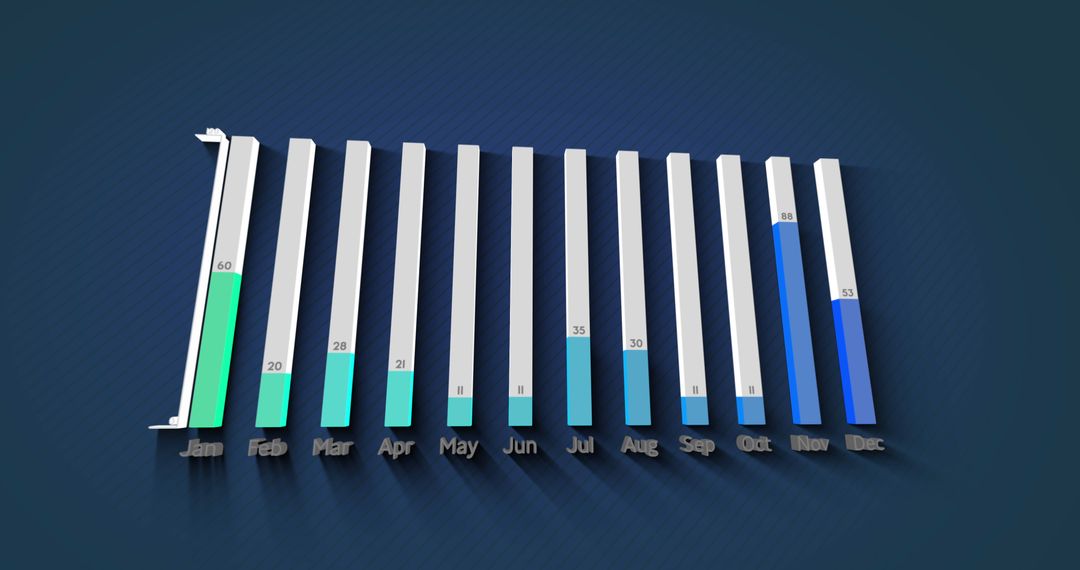
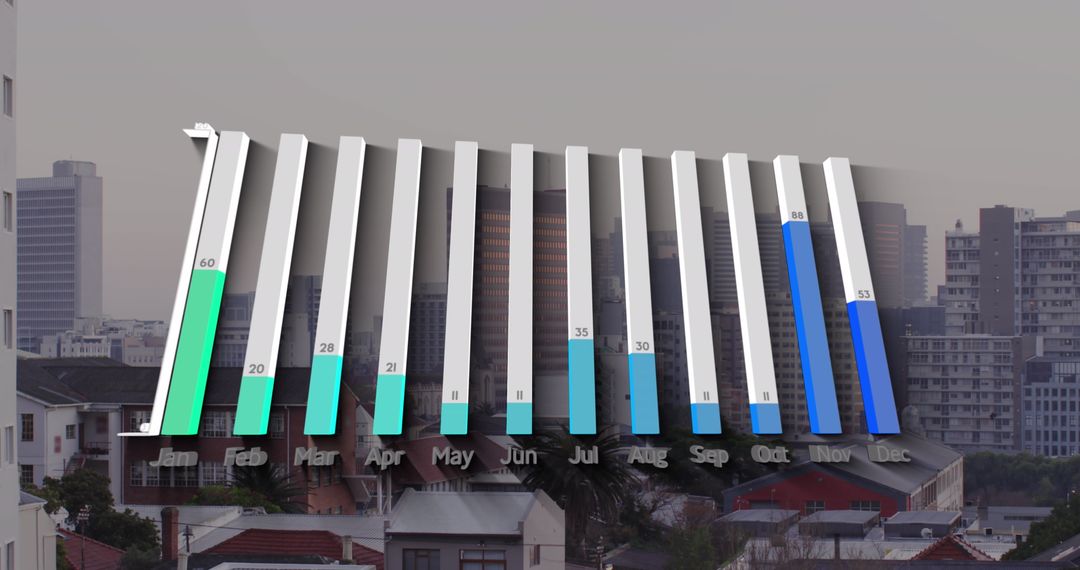
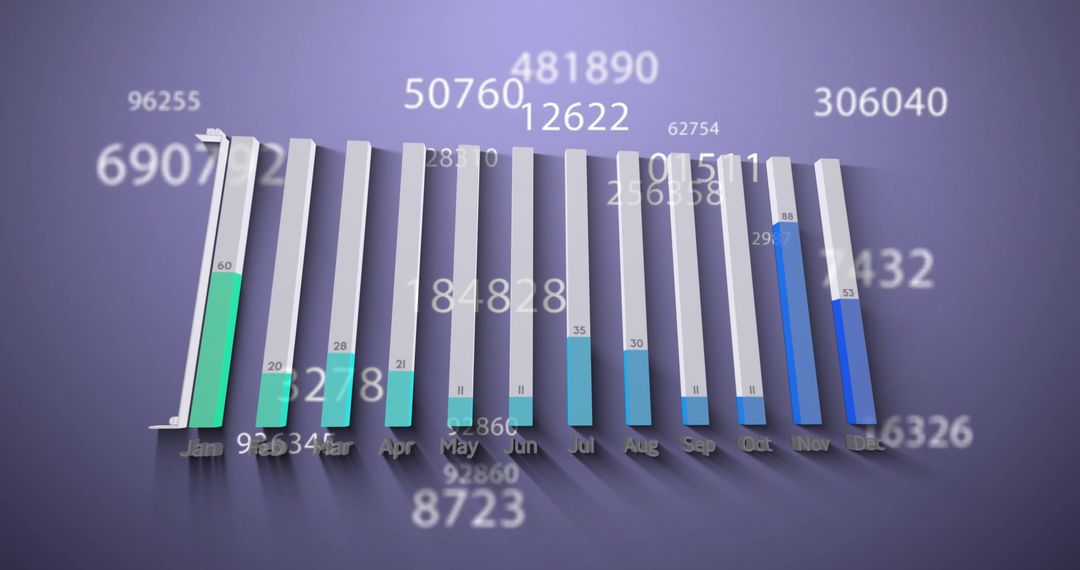
- 3D Graph Overlapping Stack of Coins Representing Financial Growth
3D Graph Overlapping Stack of Coins Representing Financial Growth Image

Visual representation of financial growth with a 3D graph positioned above stacked coins. Highlights are shown for each month, illustrating an abstract concept of currency and business expansion. Useful for presentations, reports or articles focusing on economics, business growth, and data analysis.
Powered by 


2
downloads
downloads
Tags:
More
Credit Photo
If you would like to credit the Photo, here are some ways you can do so
Text Link
photo Link
<span class="text-link">
<span>
<a target="_blank" href=https://pikwizard.com/photo/3d-graph-overlapping-stack-of-coins-representing-financial-growth/0e155a75b4c987954fb02a8627367711/>PikWizard</a>
</span>
</span>
<span class="image-link">
<span
style="margin: 0 0 20px 0; display: inline-block; vertical-align: middle; width: 100%;"
>
<a
target="_blank"
href="https://pikwizard.com/photo/3d-graph-overlapping-stack-of-coins-representing-financial-growth/0e155a75b4c987954fb02a8627367711/"
style="text-decoration: none; font-size: 10px; margin: 0;"
>
<img src="https://pikwizard.com/pw/medium/0e155a75b4c987954fb02a8627367711.jpg" style="margin: 0; width: 100%;" alt="" />
<p style="font-size: 12px; margin: 0;">PikWizard</p>
</a>
</span>
</span>
Free (free of charge)
Free for personal and commercial use.
Author: Awesome Content
Similar Free Stock Images

Premium


Premium


Premium


Premium


Premium


Premium


Premium


Premium


Premium


Premium


Premium


Premium


Premium


Premium


Premium


Premium


Premium


Premium


Premium


Premium


Premium


Premium


Premium


Premium