- Home >
- Stock Photos >
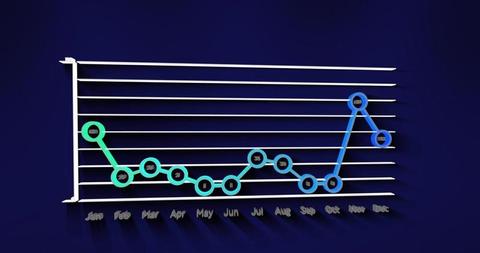
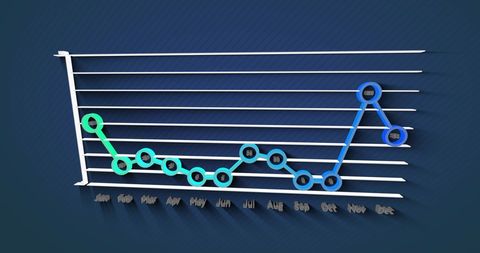
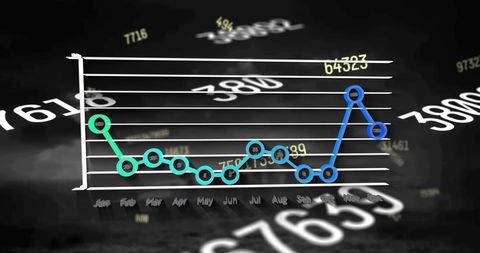
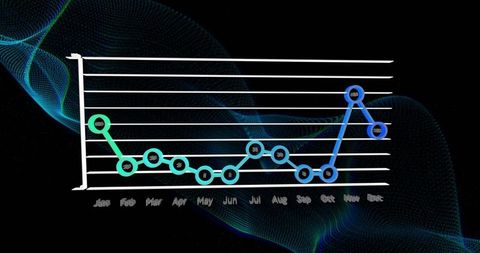
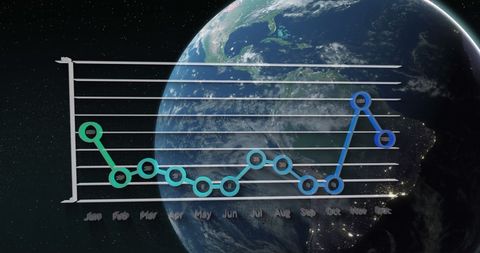
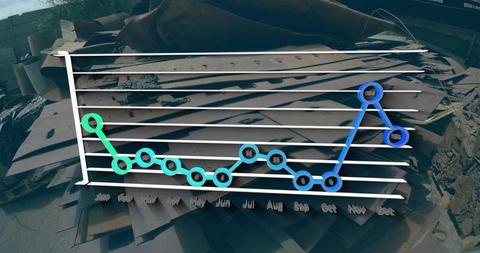
- 3D Graph Showing Monthly Data Patterns Against Glass Backdrop
3D Graph Showing Monthly Data Patterns Against Glass Backdrop Image

Vibrant 3D graph illustrates monthly data trends. Suitable for presentations, reports, or websites dealing with data analysis, business forecasting, technology development, or digital media. Atmosphere emphasizes innovation and modernity, perfect for conveying progress and technological advances.

downloads
Tags:
More
Credit Photo
If you would like to credit the Photo, here are some ways you can do so
Text Link
photo Link
<span class="text-link">
<span>
<a target="_blank" href=https://pikwizard.com/photo/3d-graph-showing-monthly-data-patterns-against-glass-backdrop/64aa53a20e44fb587debfb368a99fab3/>PikWizard</a>
</span>
</span>
<span class="image-link">
<span
style="margin: 0 0 20px 0; display: inline-block; vertical-align: middle; width: 100%;"
>
<a
target="_blank"
href="https://pikwizard.com/photo/3d-graph-showing-monthly-data-patterns-against-glass-backdrop/64aa53a20e44fb587debfb368a99fab3/"
style="text-decoration: none; font-size: 10px; margin: 0;"
>
<img src="https://pikwizard.com/pw/medium/64aa53a20e44fb587debfb368a99fab3.jpg" style="margin: 0; width: 100%;" alt="" />
<p style="font-size: 12px; margin: 0;">PikWizard</p>
</a>
</span>
</span>
Free (free of charge)
Free for personal and commercial use.
Author: Creative Art