- Home >
- Stock Photos >
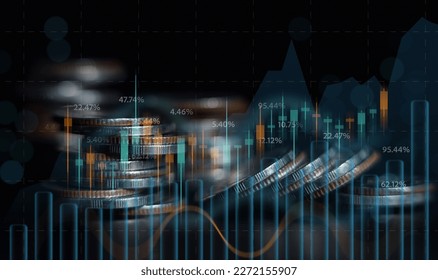
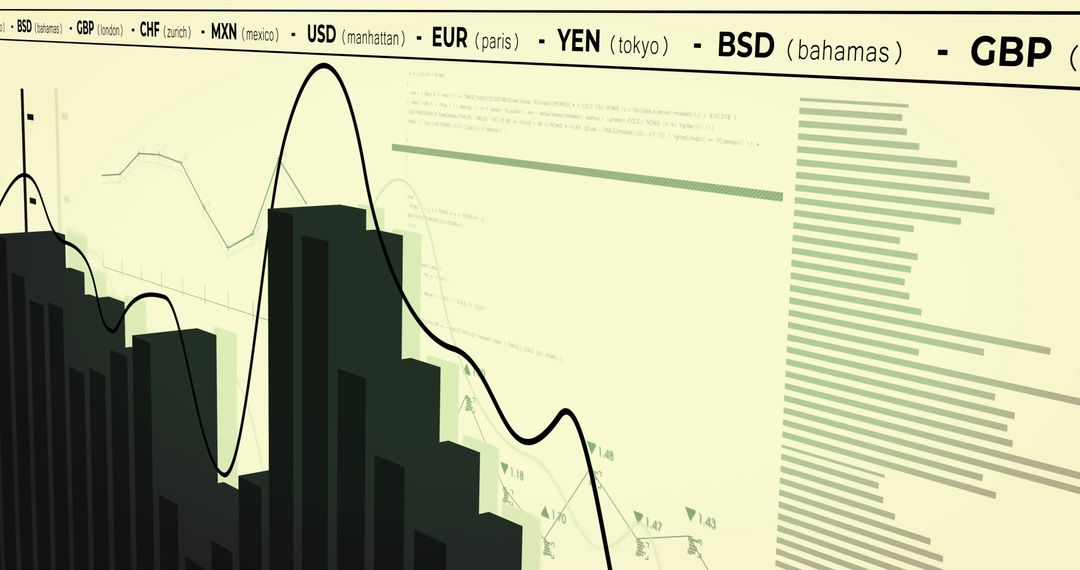
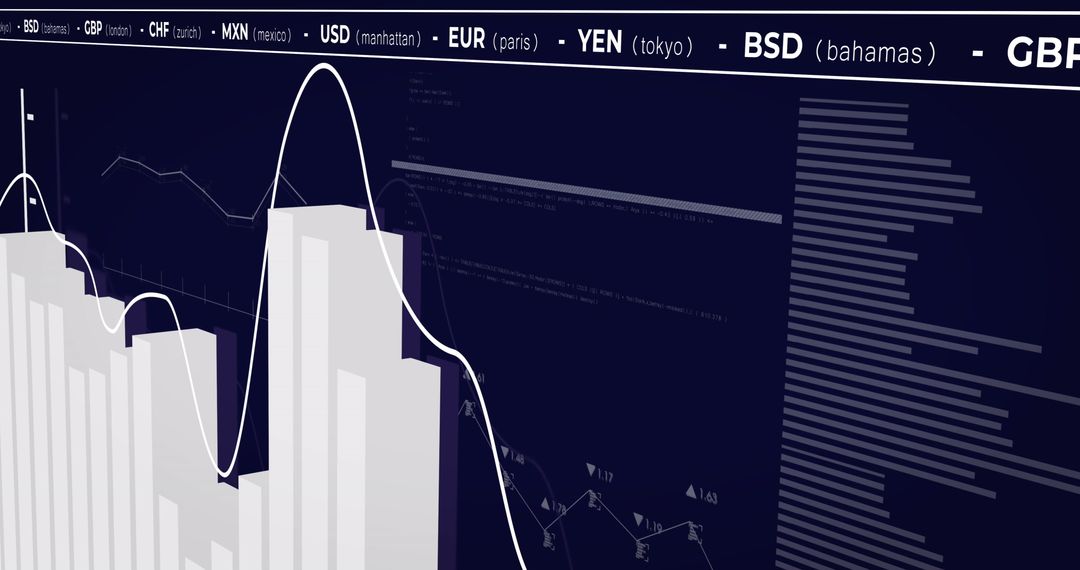
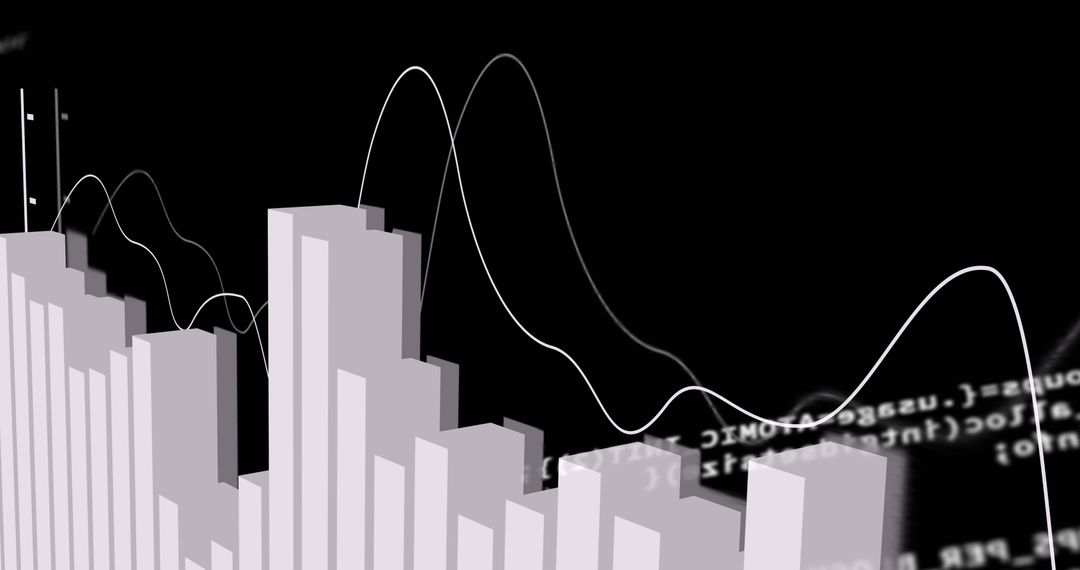
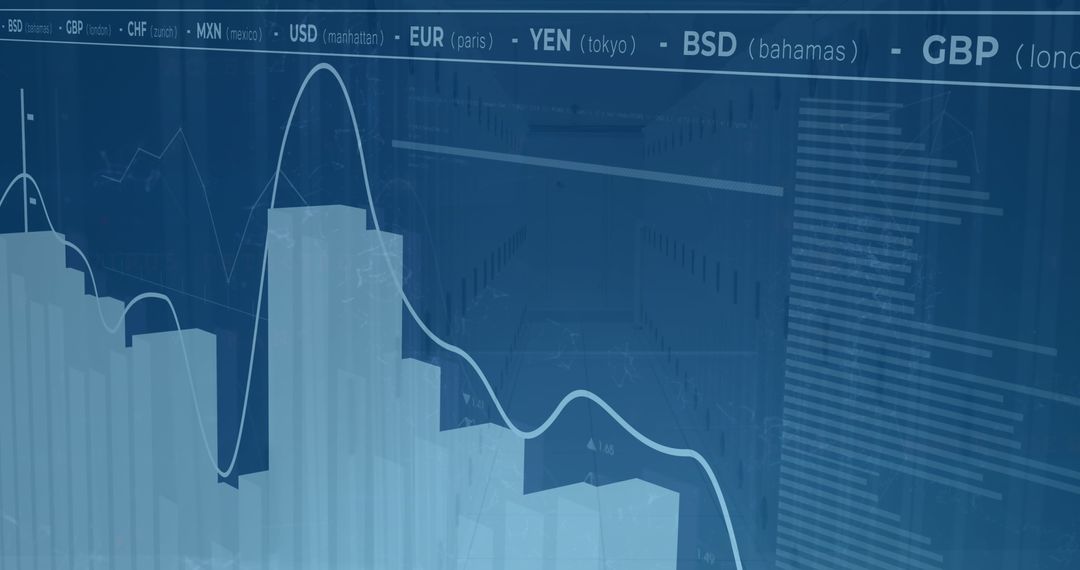
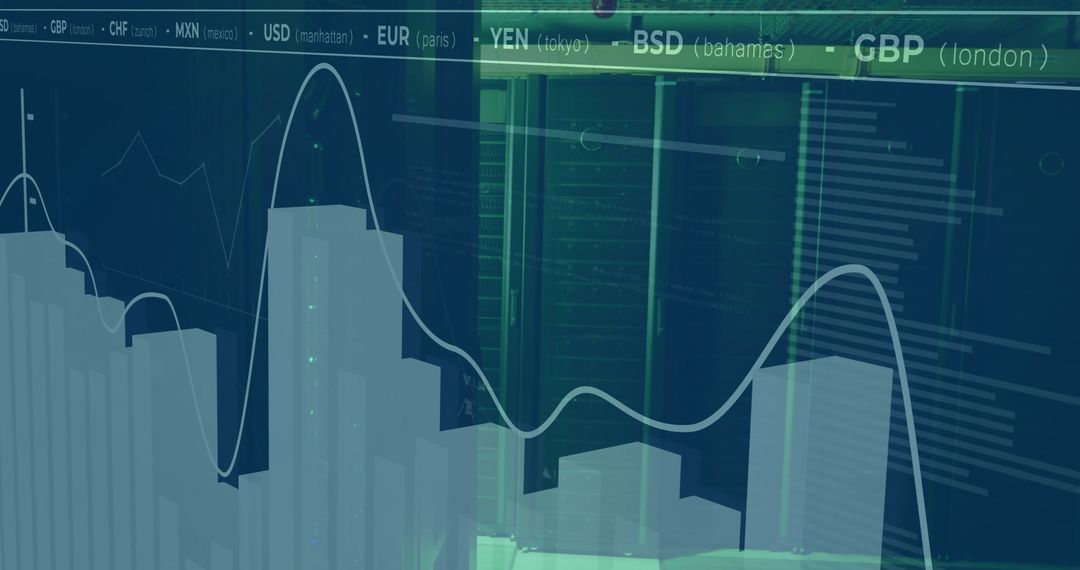
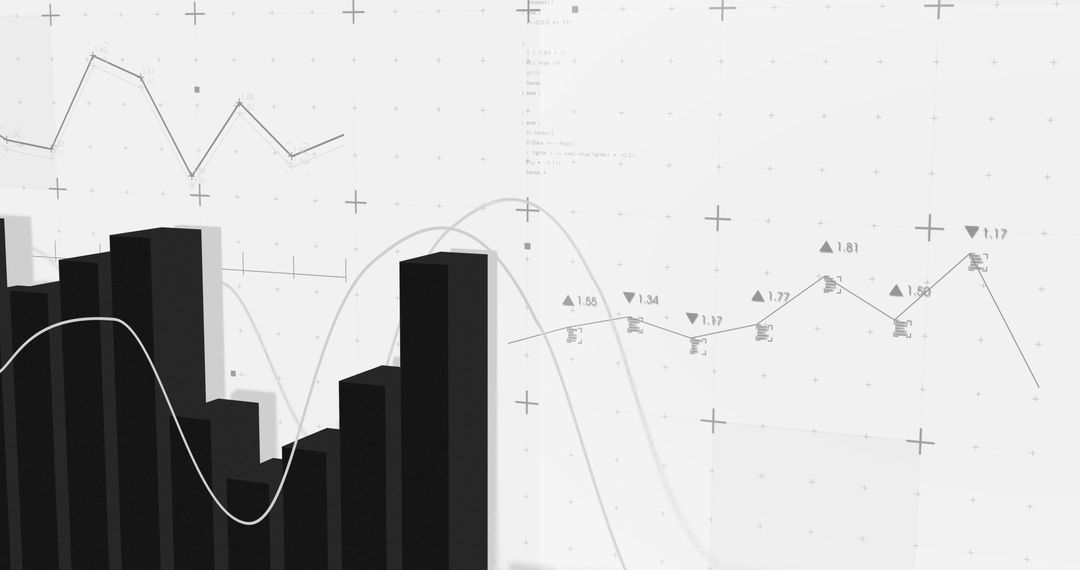
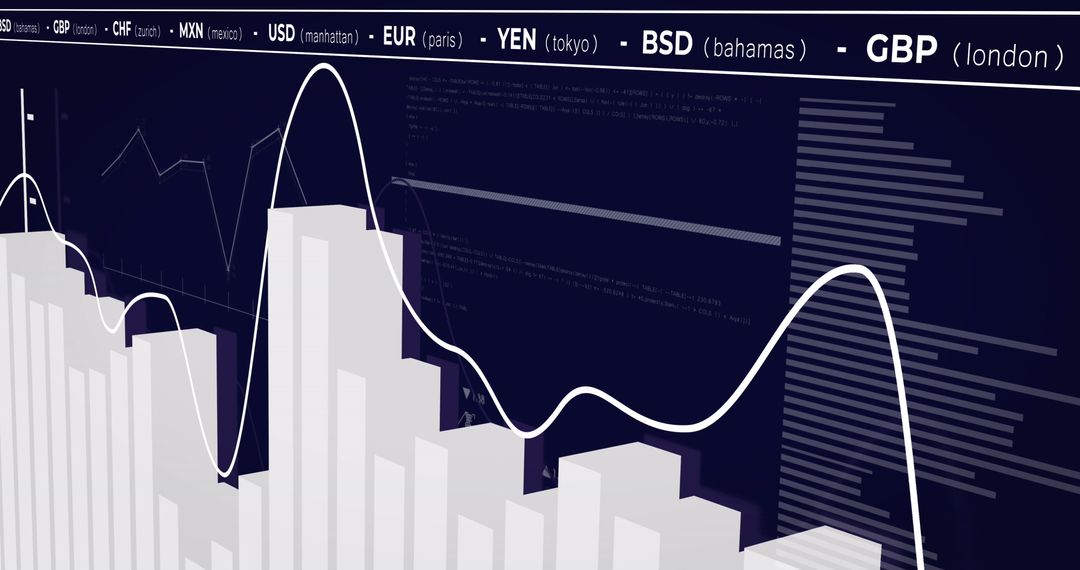
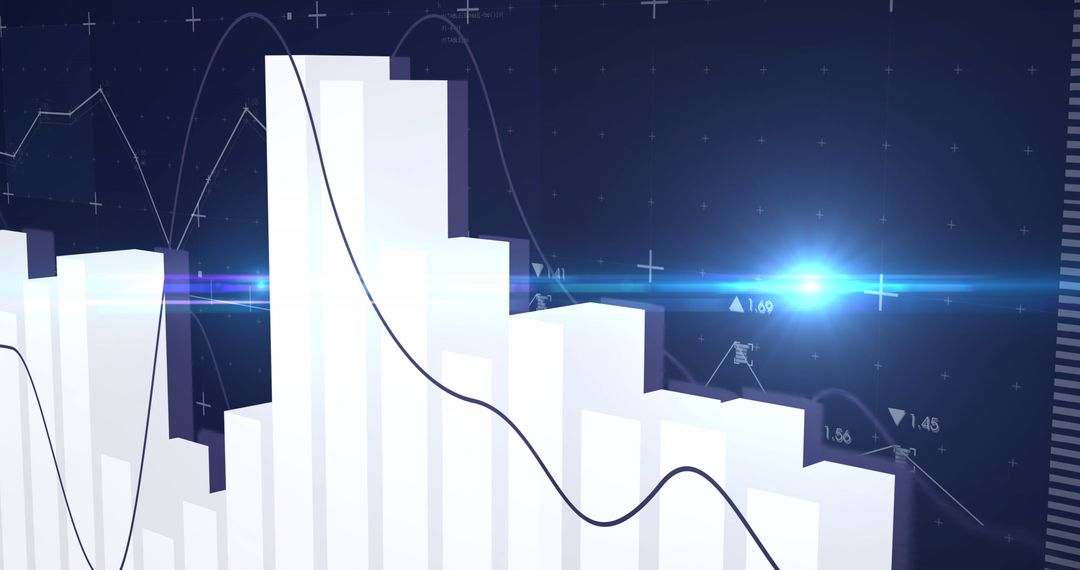
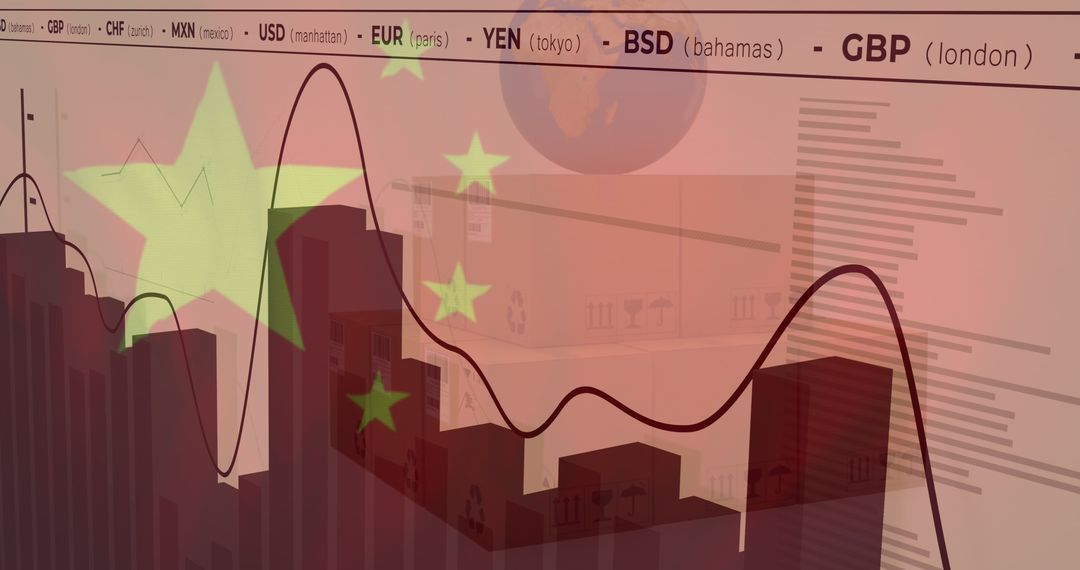
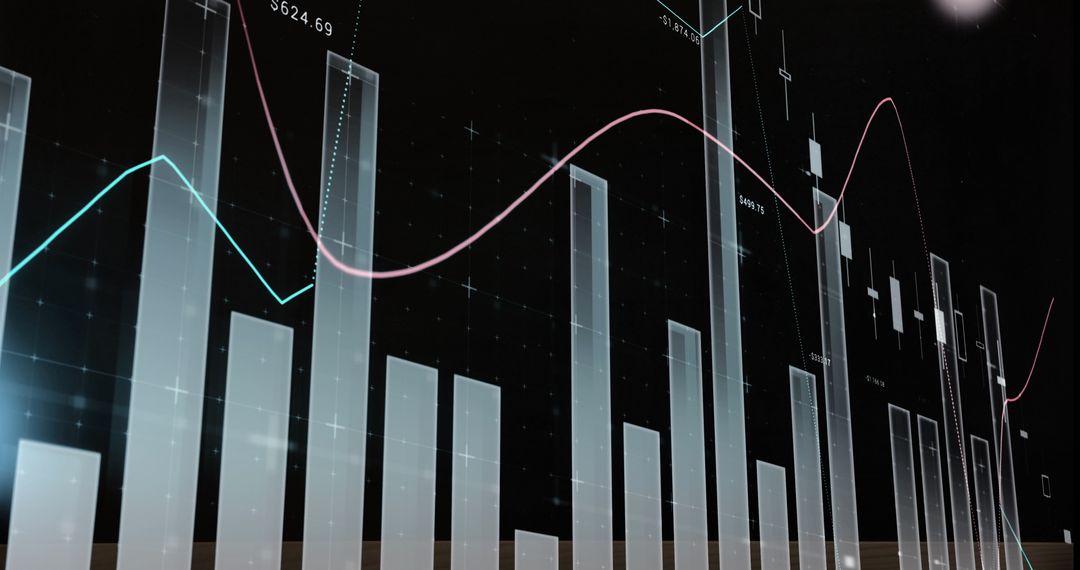
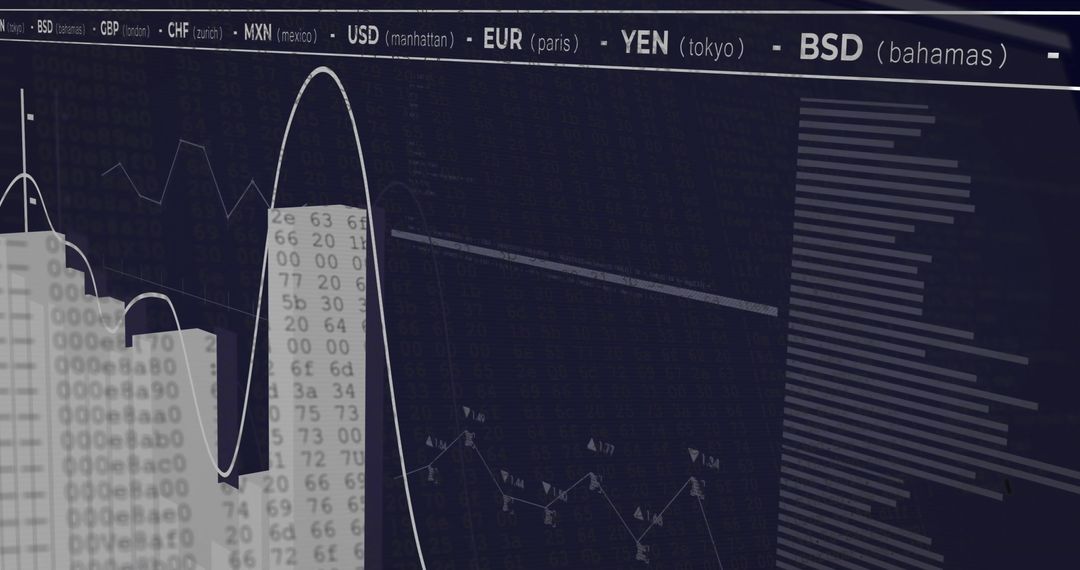
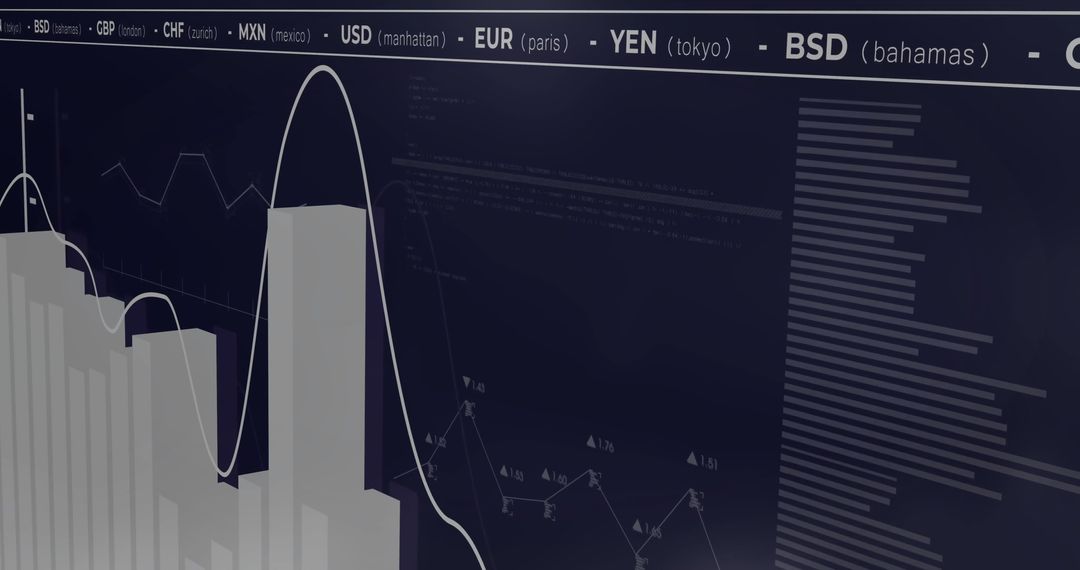
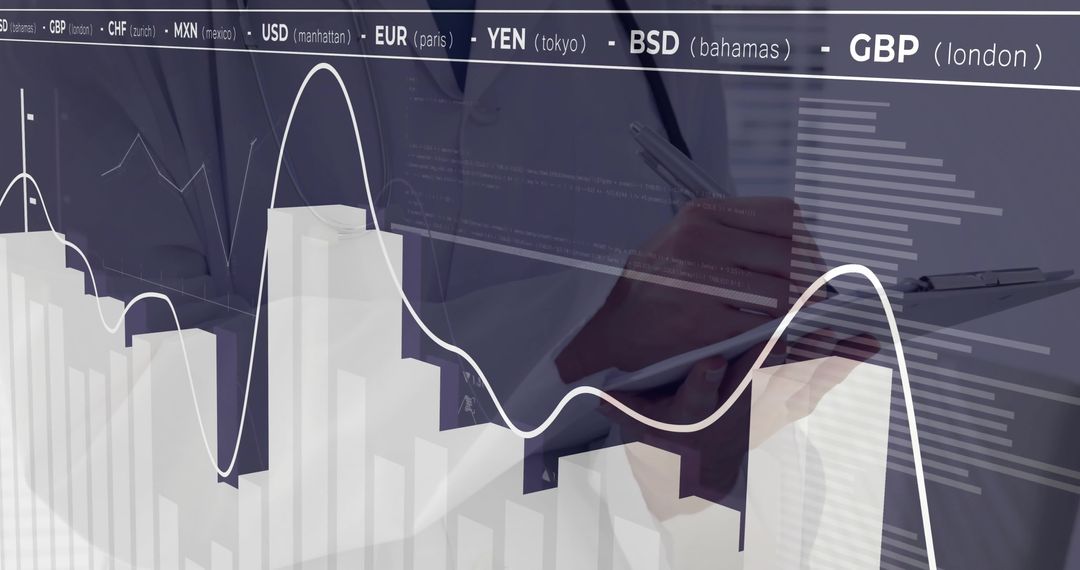
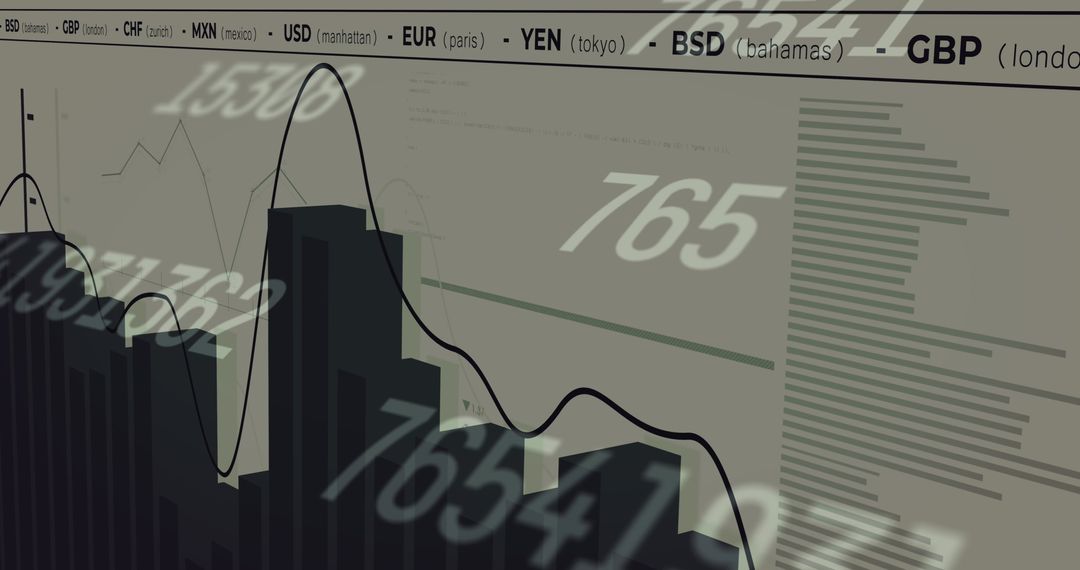
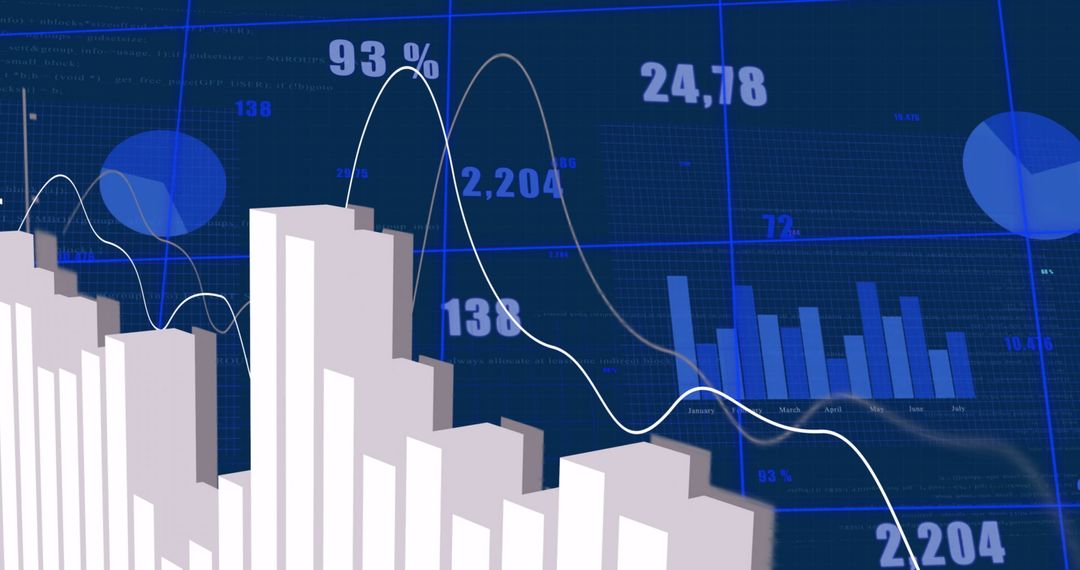
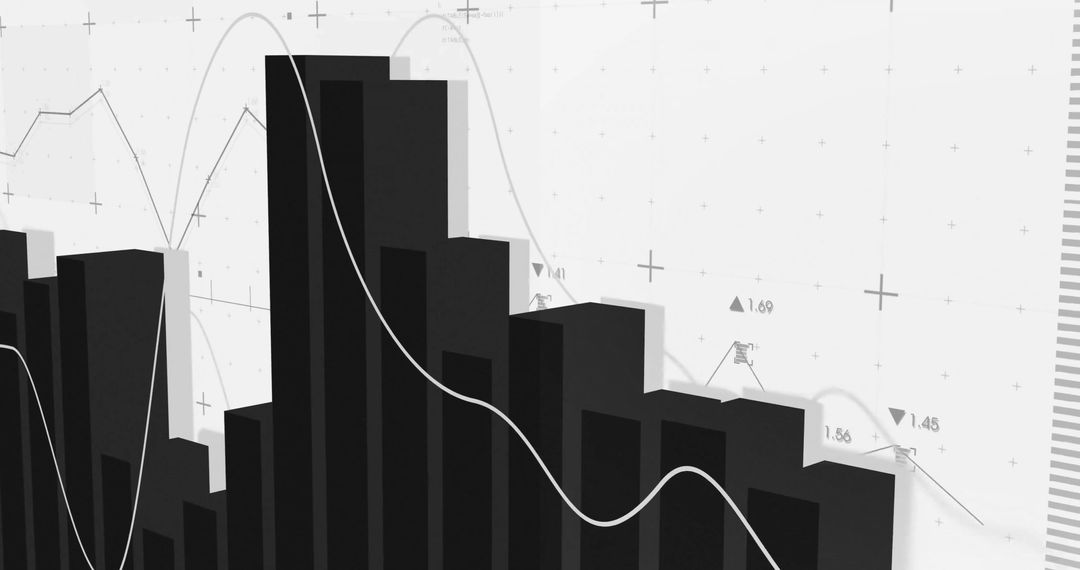
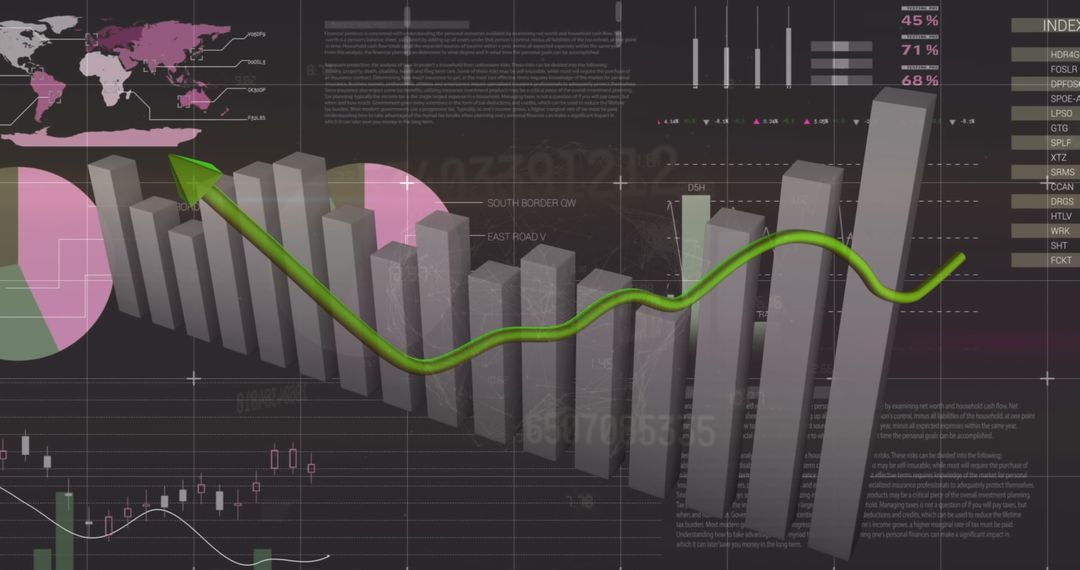
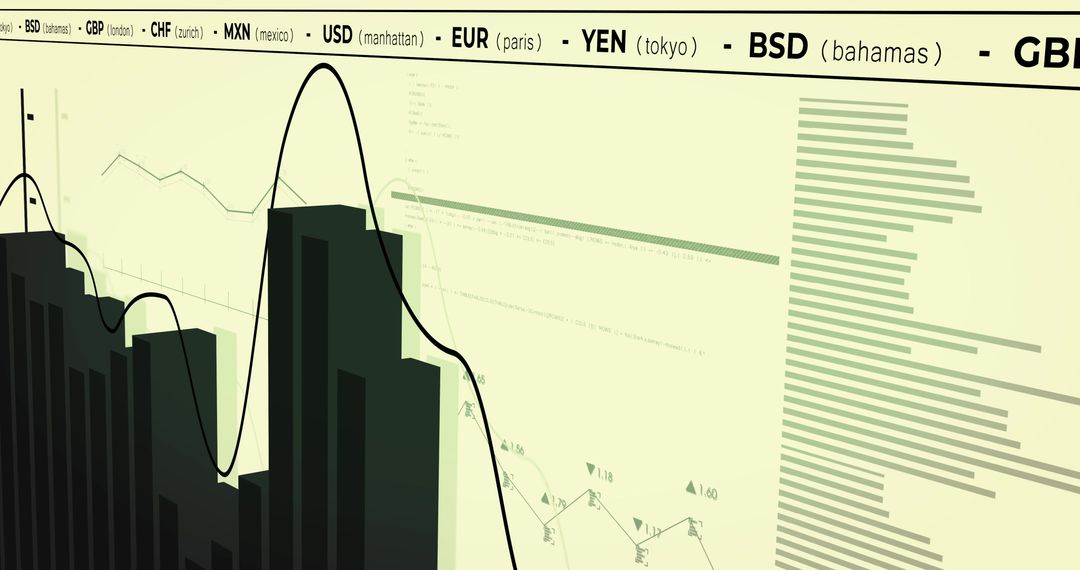
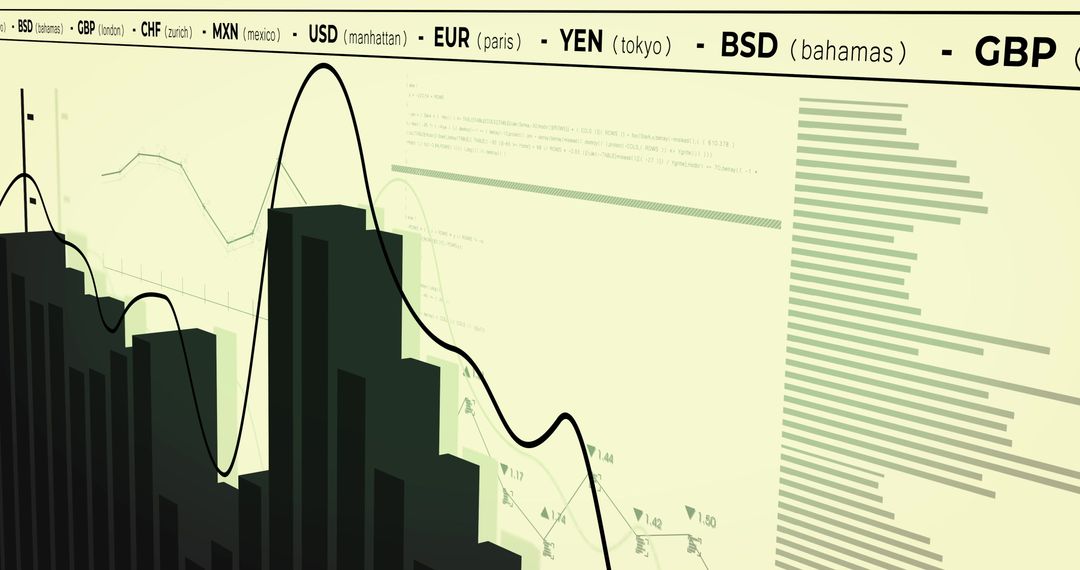
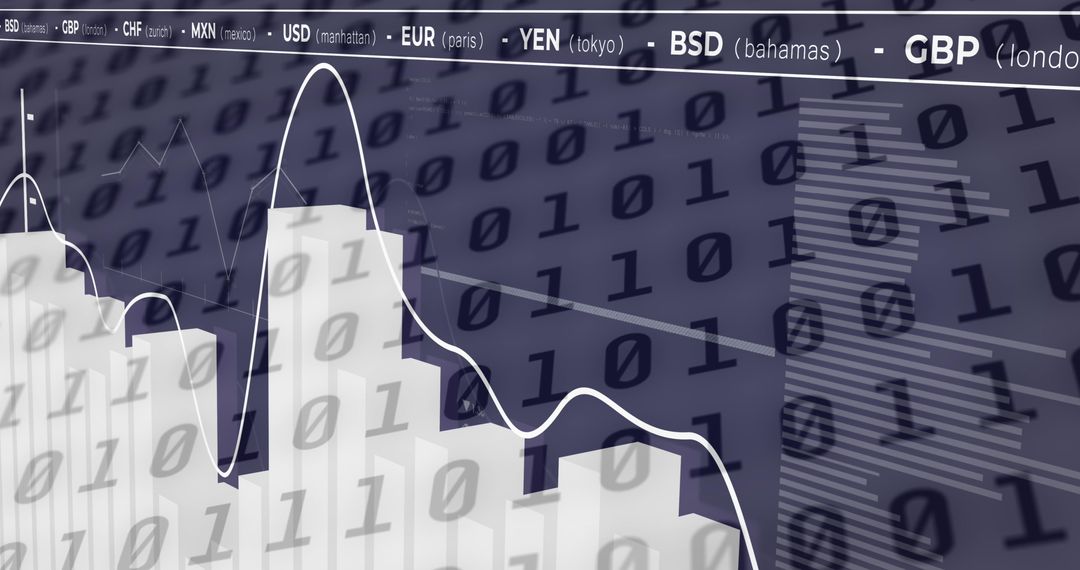
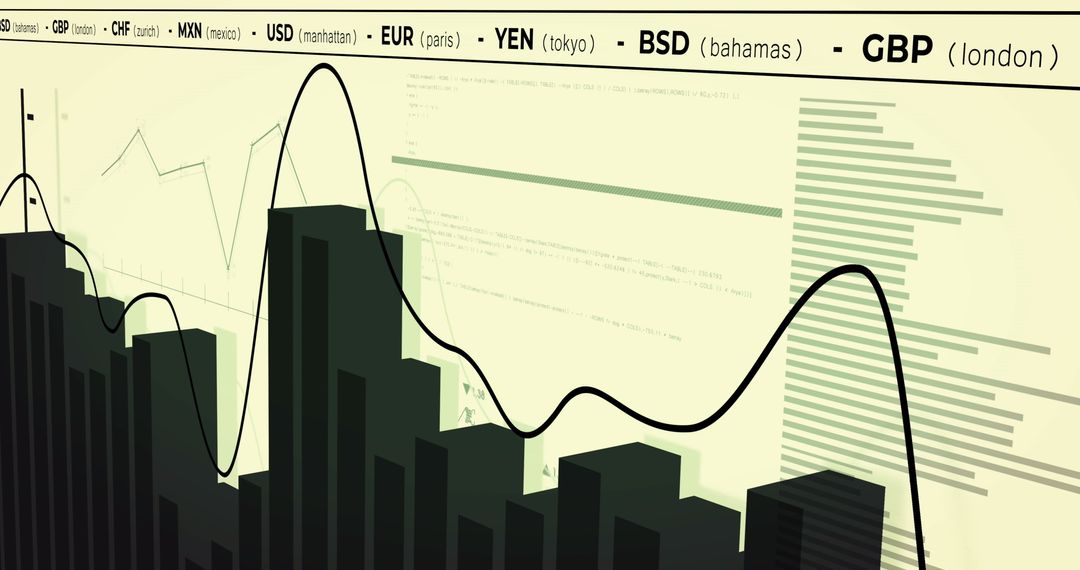
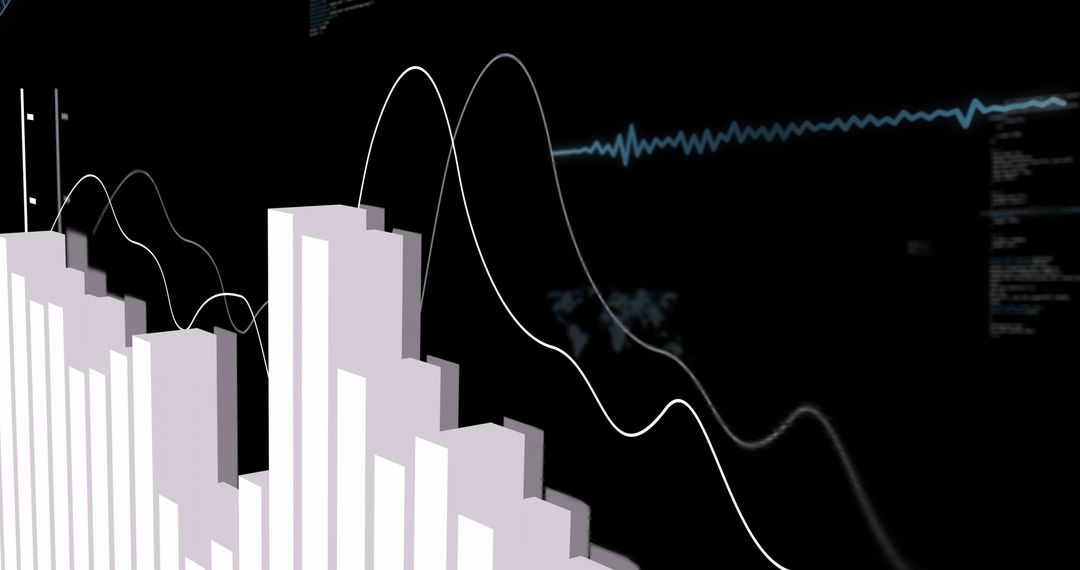
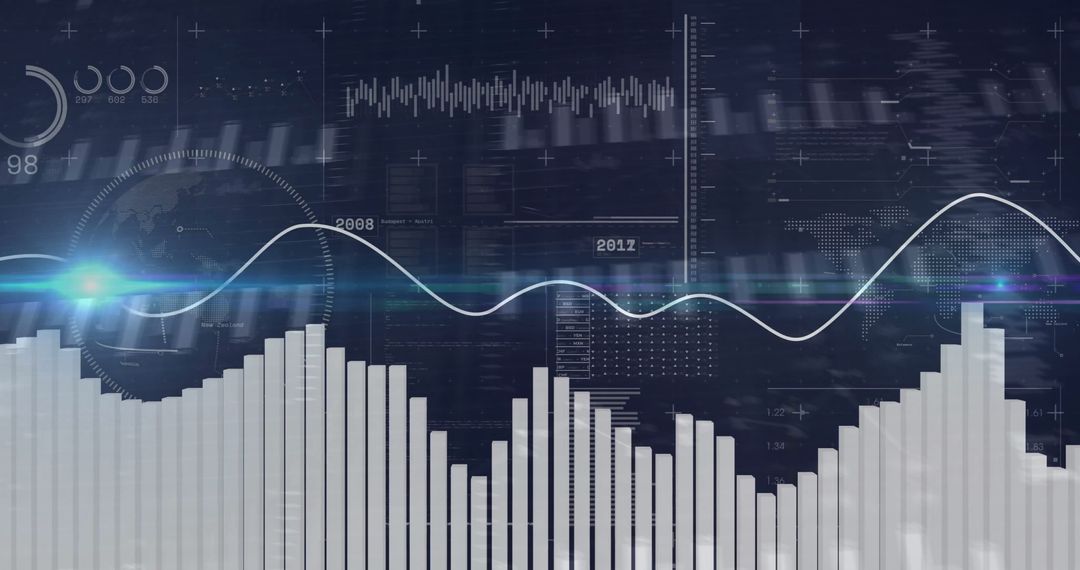
- 3D Graph with Currency Exchange Rates on Black Background
3D Graph with Currency Exchange Rates on Black Background Image

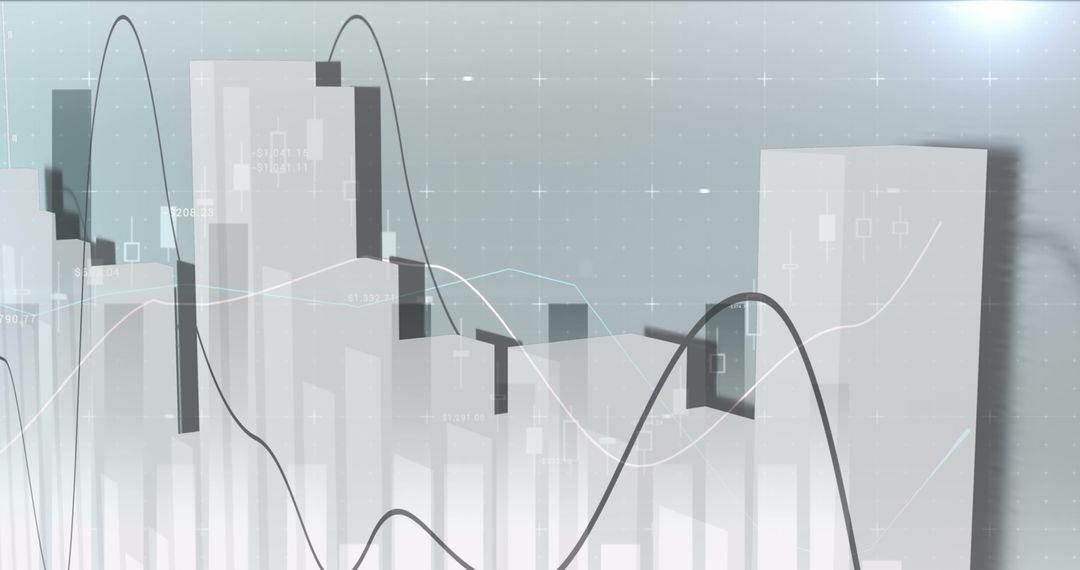
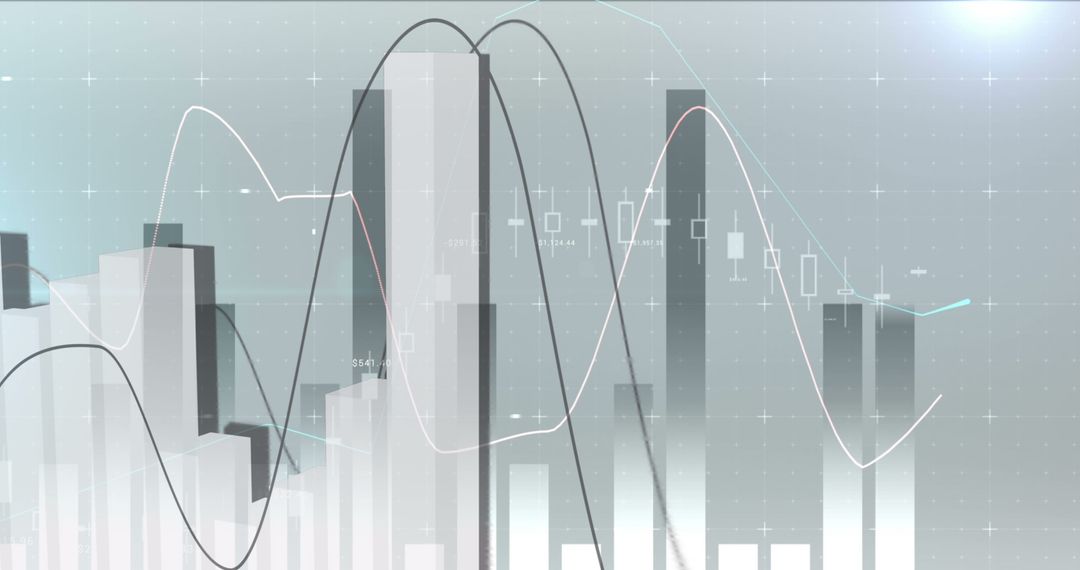
Visual features 3D graph with rising columns against a black background, showcasing currency exchange rates like USD, EUR, YEN, and GBP. Symbolizes global business, economic analysis, and digital financial data processing. Useful for presentations on market trends and data interpretation, company financial reports, and educational materials discussing economic systems and digital finance innovation.
Powered by  - Get 15% off with code: PIKWIZARD15


2
downloads
downloads
Tags:
More
Credit Photo
If you would like to credit the Photo, here are some ways you can do so
Text Link
photo Link
<span class="text-link">
<span>
<a target="_blank" href=https://pikwizard.com/photo/3d-graph-with-currency-exchange-rates-on-black-background/e08a9c6676a28ac7ad30f067d0e17065/>PikWizard</a>
</span>
</span>
<span class="image-link">
<span
style="margin: 0 0 20px 0; display: inline-block; vertical-align: middle; width: 100%;"
>
<a
target="_blank"
href="https://pikwizard.com/photo/3d-graph-with-currency-exchange-rates-on-black-background/e08a9c6676a28ac7ad30f067d0e17065/"
style="text-decoration: none; font-size: 10px; margin: 0;"
>
<img src="https://pikwizard.com/pw/medium/e08a9c6676a28ac7ad30f067d0e17065.jpg" style="margin: 0; width: 100%;" alt="" />
<p style="font-size: 12px; margin: 0;">PikWizard</p>
</a>
</span>
</span>
Free (free of charge)
Free for personal and commercial use.
Author: Authentic Images
Similar Free Stock Images
Premium


Premium


Premium


Premium


Premium


Premium


Premium


Premium


Premium


Premium


Premium


Premium


Premium


Premium


Premium


Premium

Premium


Premium


Premium


Premium


Premium


Premium


Premium


Premium