
- Home >
- Stock Photos >
- 3D Graph with Data Points and Wave Patterns
3D Graph with Data Points and Wave Patterns Image
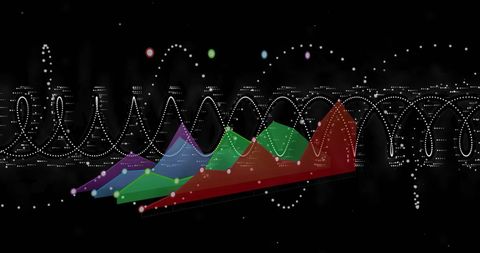
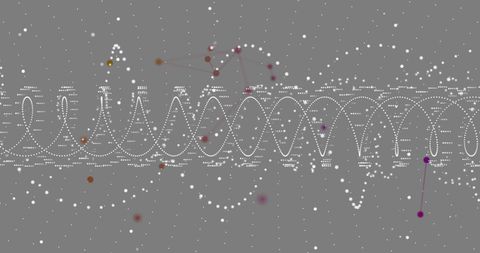
Vivid graphical representation with ascending or descending bars showing data against a backdrop of dynamic wave patterns conveys an impression of sophisticated analytics. Useful for presentations on data trends, technology in analytics, real-time data processing, reports, dashboards, and education material about understanding data through artificial intelligence visual tools. Perfect for enhancement in business strategy meetings or informative digital articles on the use of technology aids in statistical interpretations and decisions.
Powered by 


downloads
Tags:
More
Credit Photo
If you would like to credit the Photo, here are some ways you can do so
Text Link
photo Link
<span class="text-link">
<span>
<a target="_blank" href=https://pikwizard.com/photo/3d-graph-with-data-points-and-wave-patterns/99a2bfe9d081bab45ebf1a3a942b18c1/>PikWizard</a>
</span>
</span>
<span class="image-link">
<span
style="margin: 0 0 20px 0; display: inline-block; vertical-align: middle; width: 100%;"
>
<a
target="_blank"
href="https://pikwizard.com/photo/3d-graph-with-data-points-and-wave-patterns/99a2bfe9d081bab45ebf1a3a942b18c1/"
style="text-decoration: none; font-size: 10px; margin: 0;"
>
<img src="https://pikwizard.com/pw/medium/99a2bfe9d081bab45ebf1a3a942b18c1.jpg" style="margin: 0; width: 100%;" alt="" />
<p style="font-size: 12px; margin: 0;">PikWizard</p>
</a>
</span>
</span>
Free (free of charge)
Free for personal and commercial use.
Author: Awesome Content
Similar Free Stock Images

Premium


Premium


Premium


Premium


Premium


Premium


Premium


Premium


Premium

Premium


Premium


Premium

Premium


Premium

Premium

Premium


Premium


Premium


Premium


Premium


AI


Premium


Premium


Premium


Premium


Premium


Explore More Free Stock Images