- Home >
- Stock Photos >
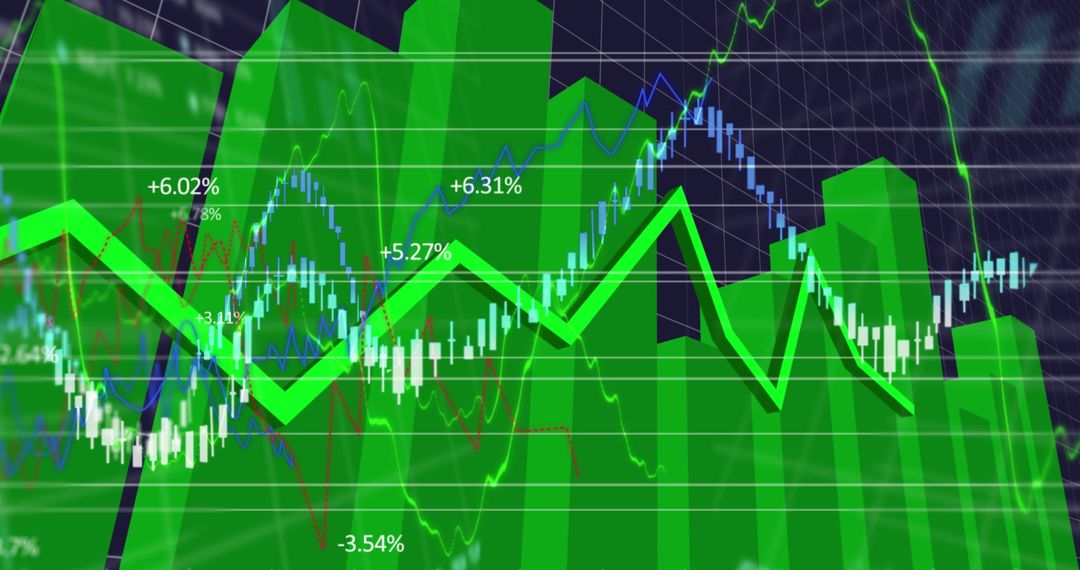
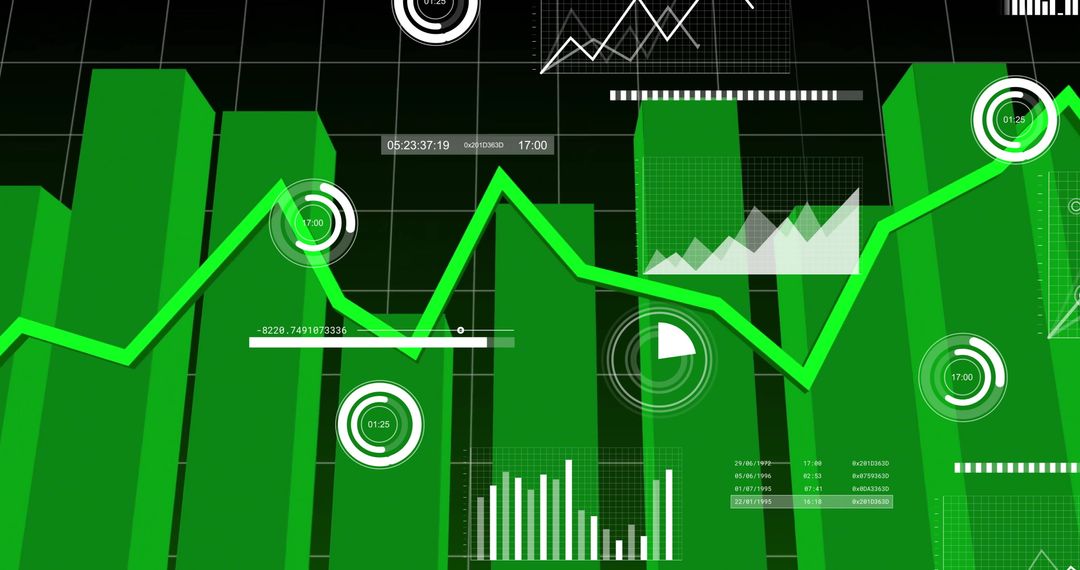
- 3D Green Bar Chart and Line Graph on Digital Dashboard
3D Green Bar Chart and Line Graph on Digital Dashboard Image

Abstract representation for financial data analysis featuring green 3D bar chart combined with line graph. Ideal for illustrating concepts related to data analytics, finance, technology, or business Intelligence. Effective for presentations, digital content on data analytics, or business reports aiming to convey advanced data processing and visualization capabilities.
Powered by  - Get 15% off with code: PIKWIZARD15


0
downloads
downloads
Tags:
More
Credit Photo
If you would like to credit the Photo, here are some ways you can do so
Text Link
photo Link
<span class="text-link">
<span>
<a target="_blank" href=https://pikwizard.com/photo/3d-green-bar-chart-and-line-graph-on-digital-dashboard/322736c8804e34508a27896174d19768/>PikWizard</a>
</span>
</span>
<span class="image-link">
<span
style="margin: 0 0 20px 0; display: inline-block; vertical-align: middle; width: 100%;"
>
<a
target="_blank"
href="https://pikwizard.com/photo/3d-green-bar-chart-and-line-graph-on-digital-dashboard/322736c8804e34508a27896174d19768/"
style="text-decoration: none; font-size: 10px; margin: 0;"
>
<img src="https://pikwizard.com/pw/medium/322736c8804e34508a27896174d19768.jpg" style="margin: 0; width: 100%;" alt="" />
<p style="font-size: 12px; margin: 0;">PikWizard</p>
</a>
</span>
</span>
Free (free of charge)
Free for personal and commercial use.
Author: Awesome Content
Similar Free Stock Images

Premium


Premium


Premium


Premium


Premium


Premium


Premium


Premium


Premium


Premium


Premium


Premium


Premium


Premium


Premium


Premium


Premium


Premium


Premium


Premium


Premium


Premium


Premium


Premium