- Home >
- Stock Photos >
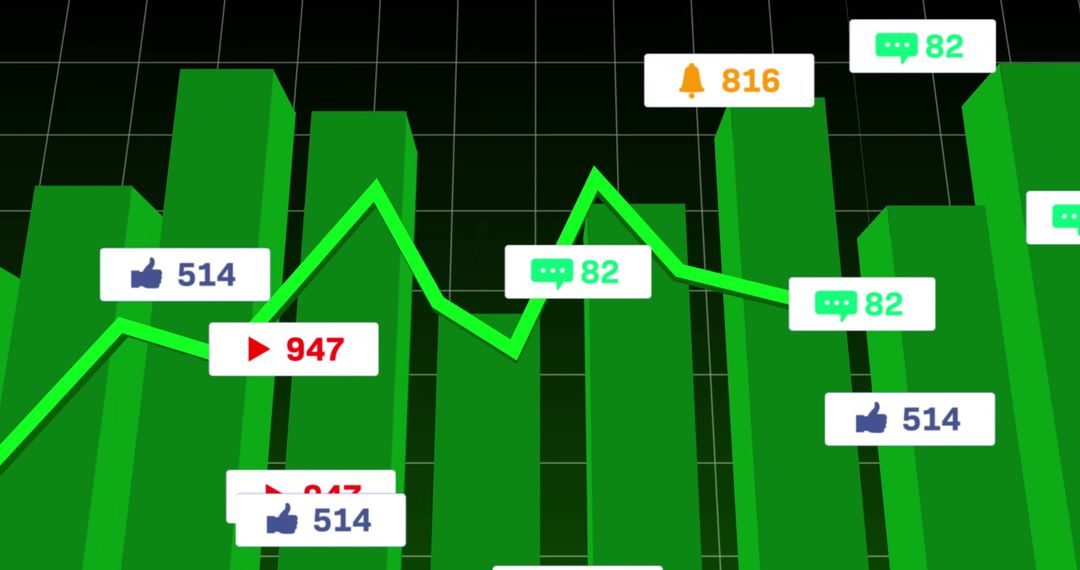
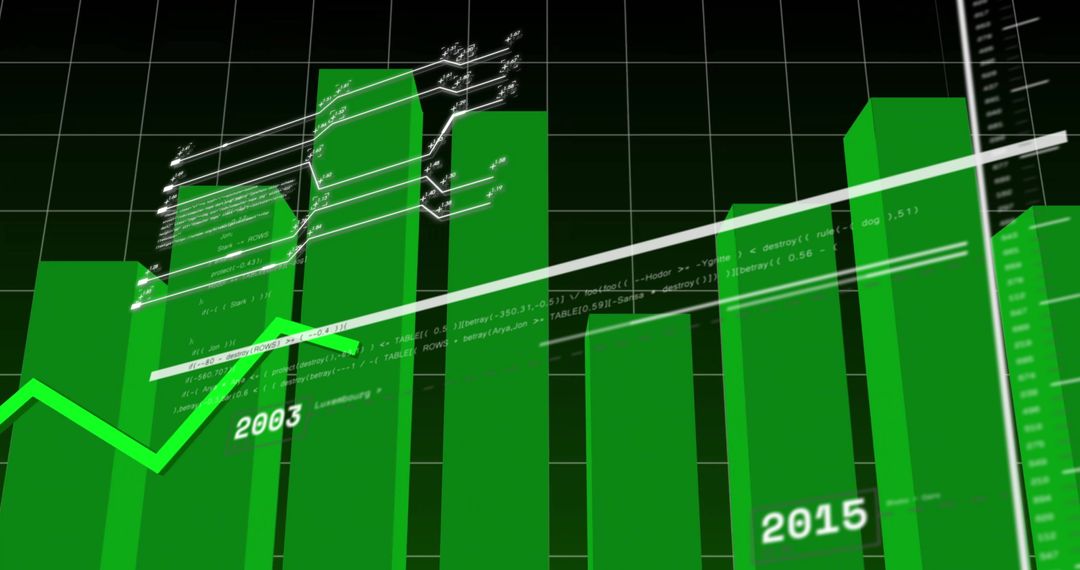
- 3D Green Bars and Line Graph on Grid Dashboard for Analytics
3D Green Bars and Line Graph on Grid Dashboard for Analytics Image

Powerful representation of data and analytics featuring 3D green bars and a fluctuating line graph on a grid dashboard. Ideal for presentations, reports, and websites focusing on business analytics, data tracking, and information technology. User icons and blue tooltip enhance insights, offering clear illustration for educational or business purposes.
Powered by  - Get 15% off with code: PIKWIZARD15


2
downloads
downloads
Tags:
More
Credit Photo
If you would like to credit the Photo, here are some ways you can do so
Text Link
photo Link
<span class="text-link">
<span>
<a target="_blank" href=https://pikwizard.com/photo/3d-green-bars-and-line-graph-on-grid-dashboard-for-analytics/155932bfb87abc1ea920919e6c4f4095/>PikWizard</a>
</span>
</span>
<span class="image-link">
<span
style="margin: 0 0 20px 0; display: inline-block; vertical-align: middle; width: 100%;"
>
<a
target="_blank"
href="https://pikwizard.com/photo/3d-green-bars-and-line-graph-on-grid-dashboard-for-analytics/155932bfb87abc1ea920919e6c4f4095/"
style="text-decoration: none; font-size: 10px; margin: 0;"
>
<img src="https://pikwizard.com/pw/medium/155932bfb87abc1ea920919e6c4f4095.jpg" style="margin: 0; width: 100%;" alt="" />
<p style="font-size: 12px; margin: 0;">PikWizard</p>
</a>
</span>
</span>
Free (free of charge)
Free for personal and commercial use.
Author: Creative Art