- Home >
- Stock Photos >
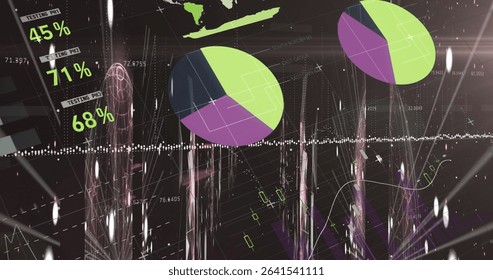
- 3D Green Dotted Line Graph with Candlestick Bars on Virtual Dashboard
3D Green Dotted Line Graph with Candlestick Bars on Virtual Dashboard Image

Visual of 3D green dotted line graph combined with candlestick bars, illustrating data points on a virtual dashboard. Suitable for depicting financial analysis, stock market trends, technology interfaces, and investment strategies. Ideal for presentations, reports, and articles related to market insights, financial forecasting, and digital transformation in business.
Powered by  - Get 15% off with code: PIKWIZARD15


0
downloads
downloads
Tags:
More
Credit Photo
If you would like to credit the Photo, here are some ways you can do so
Text Link
photo Link
<span class="text-link">
<span>
<a target="_blank" href=https://pikwizard.com/photo/3d-green-dotted-line-graph-with-candlestick-bars-on-virtual-dashboard/022e1d8758af37ff3d8c58ccf1989c32/>PikWizard</a>
</span>
</span>
<span class="image-link">
<span
style="margin: 0 0 20px 0; display: inline-block; vertical-align: middle; width: 100%;"
>
<a
target="_blank"
href="https://pikwizard.com/photo/3d-green-dotted-line-graph-with-candlestick-bars-on-virtual-dashboard/022e1d8758af37ff3d8c58ccf1989c32/"
style="text-decoration: none; font-size: 10px; margin: 0;"
>
<img src="https://pikwizard.com/pw/medium/022e1d8758af37ff3d8c58ccf1989c32.jpg" style="margin: 0; width: 100%;" alt="" />
<p style="font-size: 12px; margin: 0;">PikWizard</p>
</a>
</span>
</span>
Free (free of charge)
Free for personal and commercial use.
Author: Authentic Images
Similar Free Stock Images

Premium


Premium


Premium